CarMax 2012 Annual Report Download - page 46
Download and view the complete annual report
Please find page 46 of the 2012 CarMax annual report below. You can navigate through the pages in the report by either clicking on the pages listed below, or by using the keyword search tool below to find specific information within the annual report.-
 1
1 -
2
-
3
-
4
-
5
-
6
-
7
-
8
-
9
-
10
-
11
-
12
-
13
-
14
-
15
-
16
-
17
-
18
-
19
-
20
-
21
-
22
-
23
-
24
-
25
-
26
-
27
-
28
-
29
-
30
-
31
-
32
-
33
-
34
-
35
-
 36
36 -
 37
37 -
 38
38 -
 39
39 -
 40
40 -
 41
41 -
 42
42 -
 43
43 -
 44
44 -
 45
45 -
 46
46 -
 47
47 -
 48
48 -
 49
49 -
 50
50 -
 51
51 -
 52
52 -
 53
53 -
 54
54 -
 55
55 -
 56
56 -
57
-
58
-
59
-
60
-
61
-
62
-
63
-
64
-
65
-
66
-
67
-
68
-
69
-
70
-
71
-
72
-
73
-
74
-
75
-
76
-
77
-
78
-
79
-
80
-
81
-
82
-
83
-
84
-
85
-
86
-
87
-
88
-
89
-
90
-
91
-
92
 |
 |
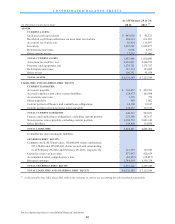
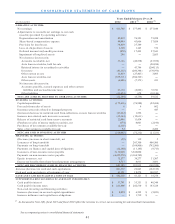
CONSOLIDATED BALANCE SHEETS
See accompanying notes to consolidated financial statements.
40
C U R R EN T A S S ETS :
Cash and cash equivalents 442,658$ 41,121$
Restricted cash from collections on auto loan receivables 204,314 161,052
Accounts receivable, net 86,434 119,597
Inventory 1,092,592 1,049,477
Deferred income taxes 9,938 5,191
Other current as sets 17,512 33,660
TO TA L C U R R EN T A S S ETS 1,853,448 1,410,098
A uto loan receivables , n et 4,959,847 4,320,575
Property and equipment, net 1,278,722 1,175,317
Deferred income taxes 133,134 123,685
Other assets 106,392 95,874
TO TA L A S S ETS $ 8,331,543 $ 7,125,549
CURRENT LIABILITIES:
Accounts payable $ 324,827 $ 269,763
Accrued expenses and other current liabilities 128,973 105,998
Accrued income taxes 3,125 772
Short-term debt 943 1,002
Current portion of finance and capital leas e obligations 14,108 12,617
Current portion of non-recourse notes payable 174,337 132,519
TO TA L C U R R EN T L IA B ILI TIES 646,313 522,671
Finance and capital leas e obligations, excluding current portion 353,566 367,617
Non-recourse notes payable, excluding current portion 4,509,752 3,881,142
Other liabilities 148,800 114,870
TO TA L LIA B IL ITIES 5,658,431 4,886,300
Co mmitmen ts an d co n ting en t liabilities
SHAREHO LDERS’ EQ UITY:
Common s tock, $0.50 par value; 350,000,000 s hares authorized;
227,118,666 and 225,885,693 s hares issued and outs tanding
as of February 29, 2012 and February 28, 2011, res pectively 113,559 112,943
Capital in excess of par value 877,493 820,639
Accumulated other comprehensive loss (62,459) (25,057)
Retained earnings 1,744,519 1,330,724
TO TA L S H A R EH O LD ER S ’ EQ U ITY 2,673,112 2,239,249
TO TAL LIABILITIES AND SHAREHO LDERS’ EQ UITY $ 8,331,543 $ 7,125,549
A S S ETS
LIABILITIES AND SHAREHO LDERS’ EQ UITY
As of February 29 or 28
(In thousands except share data) 2011 (1)
2012
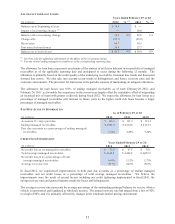
(1) As discussed in Note 2(K), fiscal 2011 reflects the revisions to correct our accounting for sale-leaseback transactions.