CarMax 2012 Annual Report Download - page 35
Download and view the complete annual report
Please find page 35 of the 2012 CarMax annual report below. You can navigate through the pages in the report by either clicking on the pages listed below, or by using the keyword search tool below to find specific information within the annual report.-
 1
1 -
2
-
3
-
4
-
5
-
6
-
7
-
8
-
9
-
10
-
11
-
12
-
13
-
14
-
15
-
16
-
17
-
18
-
19
-
20
-
21
-
22
-
23
-
24
-
 25
25 -
 26
26 -
 27
27 -
 28
28 -
 29
29 -
 30
30 -
 31
31 -
 32
32 -
 33
33 -
 34
34 -
 35
35 -
 36
36 -
 37
37 -
 38
38 -
 39
39 -
 40
40 -
 41
41 -
 42
42 -
 43
43 -
 44
44 -
 45
45 -
46
-
47
-
48
-
49
-
50
-
51
-
52
-
53
-
54
-
55
-
56
-
57
-
58
-
59
-
60
-
61
-
62
-
63
-
64
-
65
-
66
-
67
-
68
-
69
-
70
-
71
-
72
-
73
-
74
-
75
-
76
-
77
-
78
-
79
-
80
-
81
-
82
-
83
-
84
-
85
-
86
-
87
-
88
-
89
-
90
-
91
-
92
 |
 |

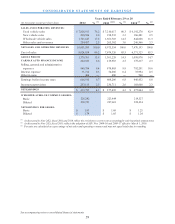
29
fiscal 2010 and earlier periods is not directly comparable to the accounting for CAF income in fiscal 2011 and
subsequent years.
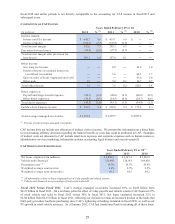
COMPONENTS OF CAF INCOME
(In millions) % (1) % (1) % (1)
Interes t margin:
Interes t and fee income $ 448.7 9.6 $ 419.1 9.9 $ ʊ ʊ
Interes t expens e (106.1) (2.3) (133.8) (3.2) ʊ ʊ
Total interes t margin 342.6 7.3 285.3 6.7 ʊ ʊ
Pro v is ion fo r lo an lo s s es (36.4) (0.8) (27.7) (0.7) ʊ ʊ
Total interest margin after provision for
loan loss es 306.2 6.6 257.6 6.1 ʊ ʊ
Other income:
Servicing fee income ʊ ʊ 0.9 ʊ 41.9 1.0
Interes t income on retained interest in
securitized receivables ʊ ʊ 1.6 ʊ 68.5 1.7
Gain on s ales of loans originated and s old ʊ ʊ ʊ ʊ 83.0 2.0
Other gain 1.5 ʊ 5.0 0.1 26.7 0.7
Total other income 1.5 ʊ 7.5 0.2 220.1 5.4
Direct expenses:
Payroll and fringe benefit expens e (20.7) (0.4) (20.6) (0.5) (20.2) (0.5)
Other direct expens es (24.8) (0.5) (24.5) (0.6) (24.7) (0.6)
Total direct expenses (45.5) (1.0) (45.1) (1.1) (44.9) (1.1)
CarMax Auto Finance income $ 262.2 5.6 $ 220.0 5.2 $ 175.2 4.3
Total average managed receivables $ 4,662.4 $ 4,229.9 $ 4,057.2
Ye ar s Ende d Fe br uar y 2 9 or 2 8
2012 2011 2010
(1) Percent of total average managed receivables.
CAF income does not include any allocation of indirect costs or income. We present this information on a direct basis
to avoid making arbitrary decisions regarding the indirect benefits or costs that could be attributed to CAF. Examples
of indirect costs not allocated to CAF include retail store expenses and corporate expenses such as human resources,
administrative services, marketing, information systems, accounting, legal, treasury and executive payroll.
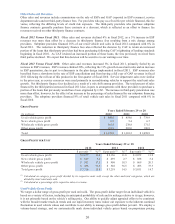
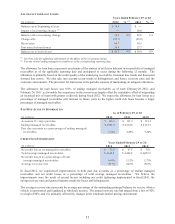
CAF ORIGINATION INFORMATION
Net lo ans originated (in million s ) 2,842.9$ 2,147.4$ 1,836.9$
Vehicle units financed 152,468 120,183 109,030
Penetration rate (2) 36.7% 29.7% 29.9%
Weighted average contract rate 8.8% 8.7% 9.5%
Weighted average term (in months) 65.3 64.5 64.2
2010
Years Ended February 29 or 28(1)
2012 2011
(1) All information relates to loans originated net of 3-day payoffs and vehicle returns.
(2) Vehicle units financed as a percentage of total retail units sold.
Fiscal 2012 Versus Fiscal 2011. CAF’s average managed receivables increased 10%, to $4.66 billion from
$4.23 billion in fiscal 2011. On a net basis (after the effect of 3-day payoffs and vehicle returns) CAF financed 37%
of retail vehicle unit sales in fiscal 2012 versus 30% in fiscal 2011. Net loans originated increased 32% to
$2.84 billion from $2.15 billion in fiscal 2011, reflecting our decision to retain an increased portion of the loans that
third-party providers had been purchasing since CAF’s tightening of lending standards in fiscal 2010, as well as our
8% growth in retail vehicle revenues. As of January 2012, CAF had transitioned back to retaining all of these loans.