CarMax 2012 Annual Report Download - page 63
Download and view the complete annual report
Please find page 63 of the 2012 CarMax annual report below. You can navigate through the pages in the report by either clicking on the pages listed below, or by using the keyword search tool below to find specific information within the annual report.-
 1
1 -
2
-
3
-
4
-
5
-
6
-
7
-
8
-
9
-
10
-
11
-
12
-
13
-
14
-
15
-
16
-
17
-
18
-
19
-
20
-
21
-
22
-
23
-
24
-
25
-
26
-
27
-
28
-
29
-
30
-
31
-
32
-
33
-
34
-
35
-
36
-
37
-
38
-
39
-
40
-
41
-
42
-
43
-
44
-
45
-
46
-
47
-
48
-
49
-
50
-
51
-
52
-
 53
53 -
 54
54 -
 55
55 -
 56
56 -
 57
57 -
 58
58 -
 59
59 -
 60
60 -
 61
61 -
 62
62 -
 63
63 -
 64
64 -
 65
65 -
 66
66 -
 67
67 -
 68
68 -
 69
69 -
 70
70 -
 71
71 -
 72
72 -
 73
73 -
74
-
75
-
76
-
77
-
78
-
79
-
80
-
81
-
82
-
83
-
84
-
85
-
86
-
87
-
88
-
89
-
90
-
91
-
92
 |
 |

57
are included in other assets, are held in a rabbi trust and are restricted to funding informally our executive deferred
compensation plan. We use quoted active market prices for identical assets to measure fair value. Therefore, all
mutual fund investments are classified as Level 1.
Retained Interest in Securitized Receivables. Prior to March 1, 2010, the retained interest in securitized receivables
included interest-only strip receivables, various reserve accounts, required excess receivables and retained
subordinated bonds. Excluding the retained subordinated bonds, we estimated the fair value of the retained interest
using internal valuation models. These models included a combination of market inputs and our own assumptions.
As the valuation models included significant unobservable inputs, we classified the retained interest as Level 3.
For the retained subordinated bonds, we based our valuation on observable market prices for similar assets when
available. Otherwise, our valuations were based on input from independent third parties and internal valuation
models. As the key assumption used in the valuation was based on unobservable inputs, we classified the retained
subordinated bonds as Level 3. As described in Note 5, there was no retained interest as of February 29, 2012, or
February 28, 2011.
Derivative Instruments. The fair values of our derivative instruments are included in either other current assets or
accounts payable. As described in Note 6, as part of our risk management strategy, we utilize derivative instruments
to manage differences in the amount of our known or expected cash receipts and our known or expected cash
payments principally related to the funding of our auto loan receivables. Our derivatives are not exchange-traded
and are over-the-counter customized derivative instruments. All of our derivative exposures are with highly rated
bank counterparties.
We measure derivative fair values assuming that the unit of account is an individual derivative instrument and that
derivatives are sold or transferred on a stand-alone basis. We estimate the fair value of our derivatives using quotes
determined by the derivative counterparties and third-party valuation services. We validate certain quotes using our
own internal models. Quotes from third-party valuation services, quotes received from bank counterparties and our
internal models project future cash flows and discount the future amounts to a present value using market-based
expectations for interest rates and the contractual terms of the derivative instruments. Because model inputs can
typically be observed in the liquid market and the models do not require significant judgment, these derivatives are
classified as Level 2.
Our derivative fair value measurements consider assumptions about counterparty and our own nonperformance risk.
We monitor counterparty and our own nonperformance risk and, in the event that we determine that a party is
unlikely to perform under terms of the contract, we would adjust the derivative fair value to reflect the
nonperformance risk.
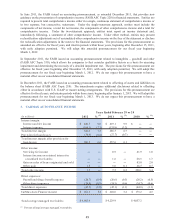
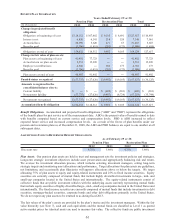
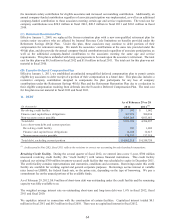
ITEMS MEASURED AT FAIR VALUE ON A RECURRING BASIS
(In m illions)
Assets:
Money market securities 458.1$ ʊ$ 458.1$
Mutual fund investments 2.6 ʊ 2.6
Derivative instruments ʊ 0.3 0.3
Total assets at fair value 460.7$ 0.3$ 461.0$
Percent of total as s ets at fair value 99.9% 0.1% 100.0%
Percent of total assets 5.5% ʊ%5.5%
Liabilities:
Derivative instruments ʊ$ 2.0$ 2.0$
Total liabilities at fair v alue ʊ$ 2.0$ 2.0$
Percen t o f total liabilities ʊ%ʊ%ʊ%
As of February 29, 2012
Level 1 Level 2 Total