CarMax 2012 Annual Report Download - page 57
Download and view the complete annual report
Please find page 57 of the 2012 CarMax annual report below. You can navigate through the pages in the report by either clicking on the pages listed below, or by using the keyword search tool below to find specific information within the annual report.-
 1
1 -
2
-
3
-
4
-
5
-
6
-
7
-
8
-
9
-
10
-
11
-
12
-
13
-
14
-
15
-
16
-
17
-
18
-
19
-
20
-
21
-
22
-
23
-
24
-
25
-
26
-
27
-
28
-
29
-
30
-
31
-
32
-
33
-
34
-
35
-
36
-
37
-
38
-
39
-
40
-
41
-
42
-
43
-
44
-
45
-
46
-
 47
47 -
 48
48 -
 49
49 -
 50
50 -
 51
51 -
 52
52 -
 53
53 -
 54
54 -
 55
55 -
 56
56 -
 57
57 -
 58
58 -
 59
59 -
 60
60 -
 61
61 -
 62
62 -
 63
63 -
 64
64 -
 65
65 -
 66
66 -
 67
67 -
68
-
69
-
70
-
71
-
72
-
73
-
74
-
75
-
76
-
77
-
78
-
79
-
80
-
81
-
82
-
83
-
84
-
85
-
86
-
87
-
88
-
89
-
90
-
91
-
92
 |
 |
51
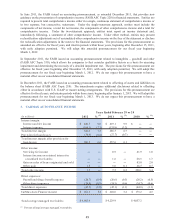
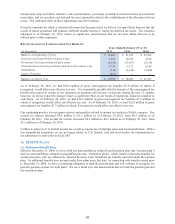
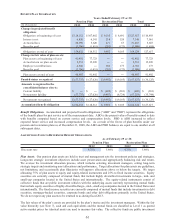
performance is reviewed on a recurring basis to identify whether the assigned grades adequately reflect the
customers’ likelihood of repayment.
ENDING MANAGED RECEIVABLES BY MAJOR CREDIT GRADE
(In millions) %
(2) % (2)
A2,452.8$ 49.2 2,234.1$ 51.5
B1,923.6 38.6 1,668.0 38.5
C and other 605.4 12.2 432.5 10.0
Total ending managed receivables 4,981.8$ 100.0 4,334.6$ 100.0
As of February 29 As of February 28
2012 (1) 2011 (1)
(1) Classified based on credit grade assigned when customers were initially approved for financing.
(2) Percent of total ending managed receivables.
ALLOWANCE FOR LOAN LOSSES
(In m illions) %
(2) %
(2)
Balance as of beginning of year 38.9$ ʊ$
Impact of accounting change (1) ʊ 58.6
Balance after accounting change 38.9 0.9 58.6 1.4
Charge-offs (92.7) (85.9)
Recoveries 60.7 38.5
Provision for loan losses 36.4 27.7
Balance as of end of year 43.3$ 0.9 38.9$ 0.9
20112012
Ye ar s Ende d Fe br uar y 2 9 or 2 8
(1) See Note 2(E) for additional information on the effects of the accounting change.
(2) Percent of total ending managed receivables as of the corresponding reporting date.
The allowance for loan losses represents an estimate of the amount of net losses inherent in our portfolio of managed
receivables as of the applicable reporting date and anticipated to occur during the following 12 months. The
allowance is primarily based on the credit quality of the underlying receivables, historical loss trends and forecasted
forward loss curves. We also take into account recent trends in delinquencies and losses, recovery rates and the
economic environment. The provision for loan losses is the periodic expense of maintaining an adequate allowance.
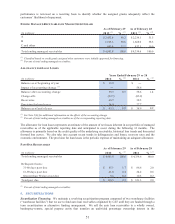
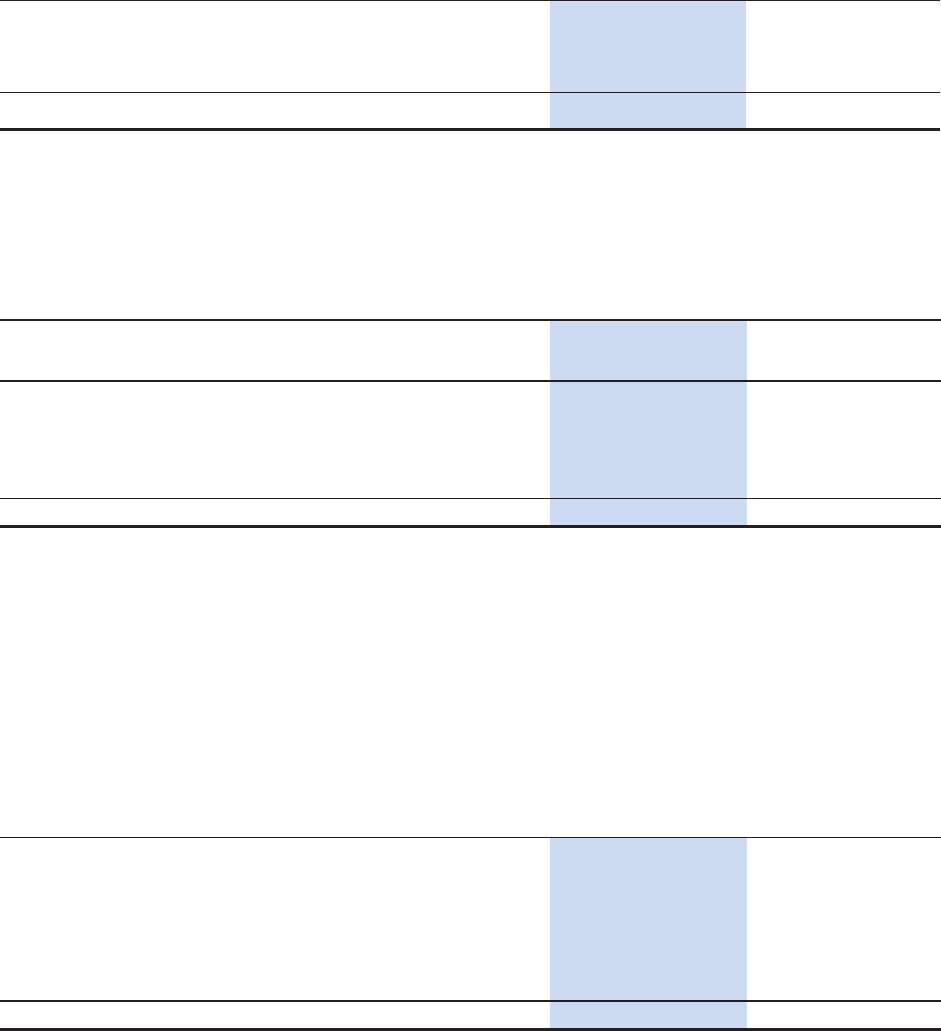
PAST DUE RECEIVABLES
(In m illions) % (1) %
(1)
Total ending managed receivables 4,981.8$ 100.0 4,334.6$ 100.0
Delinquent loans:
31-60 days past due 85.1$ 1.7 86.6$ 2.0
61-90 days past due 21.8 0.4 24.2 0.6
Greater than 90 days past due 9.6 0.2 10.5 0.2
Total pas t due 116.5$ 2.3 121.3$ 2.8
2011
As of February 28As of February 29
2012
(1) Percent of total ending managed receivables.
5. SECURITIZATIONS
Securitization Financing. We maintain a revolving securitization program composed of two warehouse facilities
(“warehouse facilities”) that we use to fund auto loan receivables originated by CAF until they are funded through a
term securitization or alternative funding arrangement. We sell the auto loan receivables to a wholly owned,
bankruptcy-remote, special purpose entity that transfers an undivided percentage ownership interest in the