CarMax 2012 Annual Report Download - page 40
Download and view the complete annual report
Please find page 40 of the 2012 CarMax annual report below. You can navigate through the pages in the report by either clicking on the pages listed below, or by using the keyword search tool below to find specific information within the annual report.-
 1
1 -
2
-
3
-
4
-
5
-
6
-
7
-
8
-
9
-
10
-
11
-
12
-
13
-
14
-
15
-
16
-
17
-
18
-
19
-
20
-
21
-
22
-
23
-
24
-
25
-
26
-
27
-
28
-
29
-
 30
30 -
 31
31 -
 32
32 -
 33
33 -
 34
34 -
 35
35 -
 36
36 -
 37
37 -
 38
38 -
 39
39 -
 40
40 -
 41
41 -
 42
42 -
 43
43 -
 44
44 -
 45
45 -
 46
46 -
 47
47 -
 48
48 -
 49
49 -
 50
50 -
51
-
52
-
53
-
54
-
55
-
56
-
57
-
58
-
59
-
60
-
61
-
62
-
63
-
64
-
65
-
66
-
67
-
68
-
69
-
70
-
71
-
72
-
73
-
74
-
75
-
76
-
77
-
78
-
79
-
80
-
81
-
82
-
83
-
84
-
85
-
86
-
87
-
88
-
89
-
90
-
91
-
92
 |
 |
34
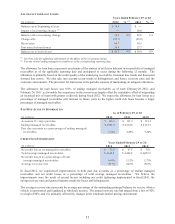
to stores to be opened in subsequent fiscal years. The increases in capital expenditures in fiscal 2012 and fiscal 2011
primarily reflected our resumption of store growth in fiscal 2011 and the ramp in planned store openings from 3
stores in fiscal 2011, to 5 stores in fiscal 2012, and 10 stores planned for fiscal 2013, as well as the 10 to 15 stores
planned for each of the following 3 fiscal years. In fiscal 2010, capital spending primarily represented expenditures
required to maintain our existing structures that were capital in nature; these expenditures were fairly modest
because of the relatively young average age of our store base.
Historically, capital expenditures have been funded with internally-generated funds, debt and sale-leaseback
transactions. No sale-leasebacks were conducted during the last three fiscal years.
As of February 29, 2012, we owned 50 and leased 58 of our 108 used car superstores.
Restricted cash from collections on auto loan receivables increased $43.3 million in fiscal 2012 compared with a
$1.6 million decrease in fiscal 2011. These collections vary depending on the timing of the receipt of principal and
interest payments on securitized auto loan receivables, the change in average managed receivables and the funding
vehicle utilized.
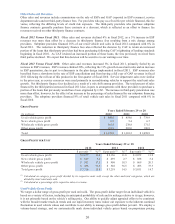
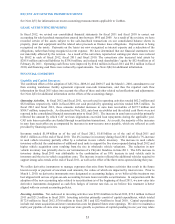
Financing Activities. Net cash provided by financing activities totaled $683.1 million in fiscal 2012 and
$101.8 million in fiscal 2011. Included in these amounts were net increases in total non-recourse notes payable of
$670.4 million in fiscal 2012 and $187.3 million in fiscal 2011, which were used to provide the financing for the
majority of the increases of $675.7 million and $304.7 million, respectively, in auto loan receivables. As discussed
in Note 2(E), non-recourse notes payable and the related cash flows were not reported in the consolidated financial
statements prior to fiscal 2011. Net cash provided by financing activities in fiscal 2011 also included a
$121.5 million net reduction in borrowings under the revolving credit facility. In fiscal 2010, net cash used in
financing activities totaled $160.5 million, which included a $186.0 million net reduction in borrowings under the
revolving credit facility.
In fiscal 2011 and fiscal 2010, the reductions in borrowings under the revolving credit facility reflected the use of
excess cash to pay down debt, as well as our relatively low levels of capital spending resulting from our temporary
suspension of store growth.
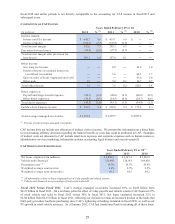
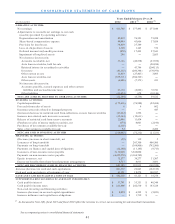
TOTAL DEBT AND CASH AND CASH EQUIVALENTS
(In m illio ns)
Non-recourse notes payable 4,684.1$ 4,013.7$ ʊ$
Borrowings under revolving credit facility 0.9 1.0 122.5
Finance and capital lease obligations 367.7 380.2 389.6
Total debt 5,052.7$ 4,394.9$ 512.1$
Cash and cash equivalents 442.7$ 41.1$ 18.3$
As of February 29 or 28
2012 2011 (1) 2010 (1)
(1) As discussed in Note 2(K), fiscal 2011 and fiscal 2010 reflect the revisions to correct our accounting for sale-leaseback
transactions.
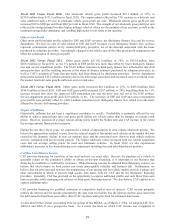
We have a $700 million unsecured revolving credit facility, which expires in August 2016. The credit facility
contains representations and warranties, conditions and covenants. As of February 29, 2012, we were in compliance
with the covenants. Borrowings under this credit facility are available for working capital and general corporate
purposes, and the unused portion is fully available to us. As of February 29, 2012, $0.9 million of short-term debt
was outstanding under the credit facility.
CAF auto loan receivables are primarily funded through securitization transactions. Our securitizations are
structured to legally isolate the auto loan receivables, and we would not expect to be able to access the assets of our
securitization vehicles, even in insolvency, receivership or conservatorship proceedings. Similarly, the investors in
the non-recourse notes payable have no recourse to our assets beyond the securitized receivables, the amounts on
deposit in reserve accounts and the restricted cash from collections on auto loan receivables. We do, however,
continue to have the rights associated with the interest we retain in these securitization vehicles.
During fiscal 2012, we completed four term securitizations, funding a total of $2.92 billion of auto loan receivables.
As of February 29, 2012, the combined warehouse facility limit was $1.6 billion. At that date, $553.0 million of