CarMax 2012 Annual Report Download - page 64
Download and view the complete annual report
Please find page 64 of the 2012 CarMax annual report below. You can navigate through the pages in the report by either clicking on the pages listed below, or by using the keyword search tool below to find specific information within the annual report.-
 1
1 -
2
-
3
-
4
-
5
-
6
-
7
-
8
-
9
-
10
-
11
-
12
-
13
-
14
-
15
-
16
-
17
-
18
-
19
-
20
-
21
-
22
-
23
-
24
-
25
-
26
-
27
-
28
-
29
-
30
-
31
-
32
-
33
-
34
-
35
-
36
-
37
-
38
-
39
-
40
-
41
-
42
-
43
-
44
-
45
-
46
-
47
-
48
-
49
-
50
-
51
-
52
-
53
-
 54
54 -
 55
55 -
 56
56 -
 57
57 -
 58
58 -
 59
59 -
 60
60 -
 61
61 -
 62
62 -
 63
63 -
 64
64 -
 65
65 -
 66
66 -
 67
67 -
 68
68 -
 69
69 -
 70
70 -
 71
71 -
 72
72 -
 73
73 -
 74
74 -
75
-
76
-
77
-
78
-
79
-
80
-
81
-
82
-
83
-
84
-
85
-
86
-
87
-
88
-
89
-
90
-
91
-
92
 |
 |
58
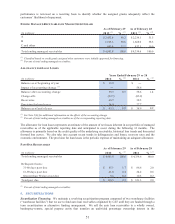
(In m illions)
Assets:
Money market securities 50.6$ ʊ$ 50.6$
Derivative instruments ʊ 3.2 3.2
To tal as s ets at fair v alue 50.6$ 3.2$ 53.8$
Percent of total assets at fair value 94.0% 6.0% 100.0%
Percent of total assets 0.7% 0.0% 0.8%
Liab ilities :
Derivative instruments ʊ$ 3.8$ 3.8$
To tal liab ilities at fair v alue ʊ$ 3.8$ 3.8$
Percen t of total liab ilities ʊ%0.1% 0.1%
Level 1 Level 2 Total
As of February 28, 2011
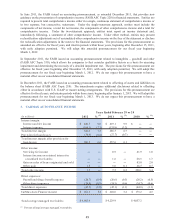
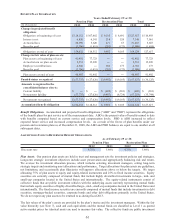
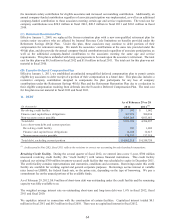
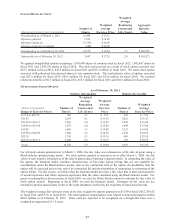
CHANGES IN LEVEL 3 ASSETS MEASURED AT FAIR VALUE ON A RECURRING BASIS
(In m illions)
Balance at beginning of year $ 552.4
Impact of accounting change (1) (508.6)
Balance as of March 1 43.7
Total realized/unrealized gains (2) 0.4
Purchases, sales, issuances and settlements, net (44.2)
Balance at end of year $ ʊ
Year Ende d
February 28, 2011
(1) See Note 2(E) for additional information on the effects of the accounting change.
(2) Reported in CarMax Auto Finance income in the consolidated statements of earnings.
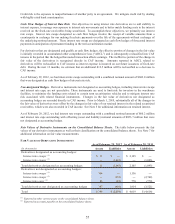
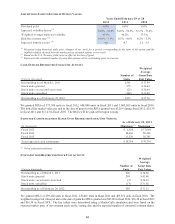
8. PROPERTY AND EQUIPMENT
(In thousands)
Lan d 232,274$ 221,997$
Lan d h eld for s ale 8,446 8,693
Land held for development 119,087 72,168
Buildings 1,033,034 1,005,416
Capital leases 1,739 1,739
Leasehold improvements 95,110 83,287
Furniture, fixtures and equipment 273,280 248,944
Construction in progress 92,393 44,894
Total property and equipment 1,855,363 1,687,138
Less accumulated depreciation and amortization 576,641 511,821
Property and equipment, net 1,278,722$ 1,175,317$
As of February 29 or 28
2012 2011 (1)
(1) As discussed in Note 2(K), fiscal 2011 reflects the revisions to correct our accounting for sale-leaseback transactions.
Land held for development represents land owned for potential expansion. Leased property meeting capital lease
criteria is capitalized and the present value of the related lease payments is recorded as long-term debt.
Accumulated amortization on capital lease assets was $0.1 million as of February 29, 2012, and February 28, 2011.