CarMax 2012 Annual Report Download - page 47
Download and view the complete annual report
Please find page 47 of the 2012 CarMax annual report below. You can navigate through the pages in the report by either clicking on the pages listed below, or by using the keyword search tool below to find specific information within the annual report.-
 1
1 -
2
-
3
-
4
-
5
-
6
-
7
-
8
-
9
-
10
-
11
-
12
-
13
-
14
-
15
-
16
-
17
-
18
-
19
-
20
-
21
-
22
-
23
-
24
-
25
-
26
-
27
-
28
-
29
-
30
-
31
-
32
-
33
-
34
-
35
-
36
-
 37
37 -
 38
38 -
 39
39 -
 40
40 -
 41
41 -
 42
42 -
 43
43 -
 44
44 -
 45
45 -
 46
46 -
 47
47 -
 48
48 -
 49
49 -
 50
50 -
 51
51 -
 52
52 -
 53
53 -
 54
54 -
 55
55 -
 56
56 -
 57
57 -
58
-
59
-
60
-
61
-
62
-
63
-
64
-
65
-
66
-
67
-
68
-
69
-
70
-
71
-
72
-
73
-
74
-
75
-
76
-
77
-
78
-
79
-
80
-
81
-
82
-
83
-
84
-
85
-
86
-
87
-
88
-
89
-
90
-
91
-
92
 |
 |

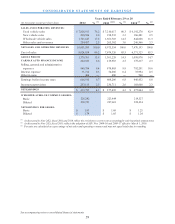
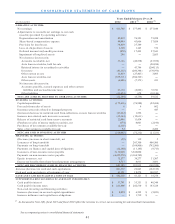
CONSOLIDATED STATEMENTS OF CASH FLOWS
See accompanying notes to consolidated financial statements.
41
(In thousands)
O PERATING ACTIVITIES:
Net earnings 413,795$ 377,495$ 277,844$
Adjustments to reconcile net earnings to net cash
(u s e d in ) p ro v id ed b y o p e rating activities :
Depreciation and amortization 82,812 76,321 75,228
Share-based compensation expense 48,089 43,606 37,858
Pro v is io n fo r lo an lo s s es 36,439 27,749 ʊ
Loss on disposition of assets 2,569 1,143 372
Deferred income tax (benefit) provision (872) 17,493 27,541
Imp airmen t o f lo n g -liv ed as s ets 248 ʊ 2,055
Net decrease (increase) in:
Accounts receivable, net 33,163 (40,538) (23,558)
A u to lo an receivab les , h eld fo r s ale ʊ ʊ (20,830)
Retained interest in securitized receivables ʊ 43,746 (204,115)
Inventory (43,115) (206,344) (139,976)
Other current assets 15,919 (27,403) 3,095
A uto loan receivables , net (675,711) (304,729) ʊ
Other assets (6,986) (7,173) 413
Net increase (decrease) in:
Accounts payable, accrued expenses and other current
liabilities and accrued income taxes 43,138 (8,802) 33,741
Other lia b ilities (11,652) 678 (10,146)
N ET C A S H ( U S ED IN ) P R O V ID ED B Y O P ER A TIN G A C TIV ITI ES (62,164) (6,758) 59,522
INVESTING AC TIVITIES:
Capital expenditures (172,616) (76,580) (22,434)
Proceeds from sales of assets 8 8 662
Insurance proceeds related to damaged property ʊ ʊ 447
(Increase) decrease in restricted cash from collections on auto loan receivables (43,262) 1,556 ʊ
Increase in restricted cash in reserve accounts (12,364) (12,631) ʊ
Release of restricted cash from reserve accounts 12,096 11,434 ʊ
(Purchases) sales of money market securities, net (678) 4,001 (2,196)
Purchases of investments available-for-sale (2,638) ʊ ʊ
Sales of in v es tmen ts av ailab le-fo r-s ale 52 ʊ 2,200
NET C ASH USED IN INVESTING AC TIVITIES (219,402) (72,212) (21,321)
FINANCING AC TIVITIES:
(Decrease) increase in short-term debt, net (59) 119 5
Issuances of long-term debt ʊ 243,300 606,500
Payments on long-term debt ʊ (364,900) (792,500)
Payments on finance and capital lease obligations (12,560) (11,145) (9,713)
Iss uances of non-recours e notes payable 5,130,000 3,348,000 ʊ
Payments on no n-recours e notes payable (4,459,572) (3,160,749) ʊ
Equity is s uances , net 15,577 38,277 31,307
Excess tax benefits from share-based payment arrangements 9,717 8,911 3,881
NET C ASH PRO VIDED BY (USED IN) FINANCING AC TIVITIES 683,103 101,813 (160,520)
Increase (decrease) in cas h and cas h equivalents 401,537 22,843 (122,319)
Cash and cash equivalents at beginning of year 41,121 18,278 140,597
CASH AND C ASH EQ UIVALENTS AT END O F YEAR 442,658$ 41,121$ 18,278$
SUPPLEMENTAL DISCLOSURES OF CASH FLOW INFORMATION
Cash paid for interes t 33,741$ 35,351$ 40,344$
Cash paid for income taxes 223,806$ 242,510$ 163,324$
Non-cash investing and financing activities:
Increase (decrease) in accrued capital expenditures 8,859$ 6,395$ (5,823)$
Increase in finance and capital lease obligations ʊ$ 1,739$ ʊ$
Ye ar s Ende d Fe br uar y 2 9 or 2 8
2012 2011 (1) 2010 (1)
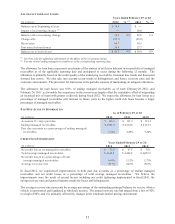
(1) As discussed in Note 2(K), fiscal 2011 and fiscal 2010 reflect the revisions to correct our accounting for sale-leaseback transactions.