CarMax 2012 Annual Report Download - page 27
Download and view the complete annual report
Please find page 27 of the 2012 CarMax annual report below. You can navigate through the pages in the report by either clicking on the pages listed below, or by using the keyword search tool below to find specific information within the annual report.-
 1
1 -
2
-
3
-
4
-
5
-
6
-
7
-
8
-
9
-
10
-
11
-
12
-
13
-
14
-
15
-
16
-
 17
17 -
 18
18 -
 19
19 -
 20
20 -
 21
21 -
 22
22 -
 23
23 -
 24
24 -
 25
25 -
 26
26 -
 27
27 -
 28
28 -
 29
29 -
 30
30 -
 31
31 -
 32
32 -
 33
33 -
 34
34 -
 35
35 -
 36
36 -
 37
37 -
38
-
39
-
40
-
41
-
42
-
43
-
44
-
45
-
46
-
47
-
48
-
49
-
50
-
51
-
52
-
53
-
54
-
55
-
56
-
57
-
58
-
59
-
60
-
61
-
62
-
63
-
64
-
65
-
66
-
67
-
68
-
69
-
70
-
71
-
72
-
73
-
74
-
75
-
76
-
77
-
78
-
79
-
80
-
81
-
82
-
83
-
84
-
85
-
86
-
87
-
88
-
89
-
90
-
91
-
92
 |
 |
21
allowing them to choose the ones that best fit their needs. In addition, customers are permitted to refinance or pay
off their contract within three business days of a purchase without incurring any finance or related charges. We
randomly test different credit offers and closely monitor acceptance rates and 3-day payoffs to assess market
competitiveness. After the effect of 3-day payoffs and vehicle returns, CAF financed 37% of our retail vehicle unit
sales in fiscal 2012. As of February 29, 2012, CAF serviced approximately 414,000 customers in its $4.98 billion
portfolio of managed receivables.
We sell ESPs and GAP on behalf of unrelated third parties who are the primary obligors. As of February 29, 2012,
the used vehicle third-party ESP providers were CNA National Warranty Corporation and The Warranty Group, and
the third-party GAP provider was Safe-Guard Products International, LLC. We have no contractual liability to the
customer under these third-party plans. ESP revenue represents commissions received on the sale of ESPs and GAP
from the unrelated third parties.
Over the long term, we believe the primary driver for earnings growth will be vehicle unit sales growth from both
new stores and stores included in our comparable store base. We target a dollar range of gross profit per used unit
sold. The gross profit dollar target for an individual vehicle is based on a variety of factors, including its probability
of sale and its mileage relative to its age; however, it is not primarily based on the vehicle’s selling price. Our
ability to quickly adjust appraisal offers to be consistent with the broader market trade-in trends and our inventory
management practices reduce our exposure to the inherent continual fluctuation in used vehicle values and
contribute to our ability to manage gross profit dollars per unit. We employ a volume-based strategy, and we
systematically mark down individual vehicle prices based on proprietary pricing algorithms in order to appropriately
balance sales trends, inventory turns and gross profit achievement.
In December 2008, we temporarily suspended store growth due to the weak economic and sales environment. We
resumed store growth in fiscal 2011, opening three superstores that year and five superstores in fiscal 2012. We
plan to open 10 superstores in fiscal 2013 and between 10 and 15 superstores in each of the following 3 fiscal years.
While we have more than 100 superstores, we are still in the midst of the national rollout of our retail concept, and
as of February 29, 2012, we had used car superstores located in markets that comprised approximately 50% of the
U.S. population.
The principal challenges we face in expanding our store base include our ability to build our management bench
strength to support our store growth and our ability to procure suitable real estate at favorable terms. We staff each
newly opened store with associates who have extensive CarMax training. Therefore, we must recruit, train and
develop managers and associates to fill the pipeline necessary to support future store openings.
Fiscal 2012 Highlights
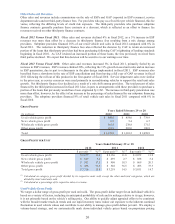
x Net sales and operating revenues increased 11% to $10.00 billion from $8.98 billion in fiscal 2011, while net
earnings increased 10% to $413.8 million, or $1.79 per share, from $377.5 million, or $1.65 per share.
x Total used vehicle revenues increased 9% to $7.83 billion versus $7.21 billion in fiscal 2011. The average used
vehicle selling price rose 5%, primarily reflecting increases in our acquisition costs, which were affected by a
year-over-year increase in used vehicle wholesale values. Total used vehicle unit sales rose 3%, reflecting the
combination of a 1% increase in comparable store used unit sales and sales from newer stores not yet included
in the comparable store base. We believe the modest rate of increase in comparable store sales reflected both a
challenging sales comparison with fiscal 2011, when comparable store used unit sales increased 10%, and the
continuation of weak economic conditions and low consumer confidence for much of the current fiscal year.
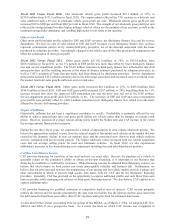
x Total wholesale vehicle revenues increased 32% to $1.72 billion versus $1.30 billion in fiscal 2011. Wholesale
vehicle unit sales increased 20%, reflecting a significant increase in appraisal traffic. The average wholesale
vehicle selling price rose 10%, due to the year-over-year increase in industry wholesale prices.
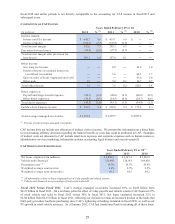
x Total gross profit increased 6% to $1.38 billion compared with $1.30 billion in fiscal 2011. The increase was
largely driven by improvements in our wholesale and used vehicle gross profits, partially offset by a decrease in
other gross profit. Wholesale vehicle gross profits increased 26% due the combination of the 20% growth in
unit sales and a 5% increase in gross profit per unit. Used vehicle gross profits improved 4%, primarily
reflecting the 3% increase in unit sales. Other gross profit declined 10% due to reductions in both third-party
finance fees and service department profits.
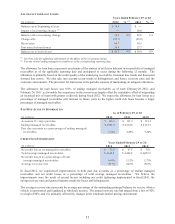
x CAF income increased 19% to $262.2 million versus $220.0 million in fiscal 2011. Interest and fee income
increased $29.6 million primarily due to the growth in average managed receivables, while at the same time
interest expense declined $27.7 million as a larger portion of our portfolio of managed receivables was funded