CarMax 2012 Annual Report Download - page 76
Download and view the complete annual report
Please find page 76 of the 2012 CarMax annual report below. You can navigate through the pages in the report by either clicking on the pages listed below, or by using the keyword search tool below to find specific information within the annual report.-
 1
1 -
2
-
3
-
4
-
5
-
6
-
7
-
8
-
9
-
10
-
11
-
12
-
13
-
14
-
15
-
16
-
17
-
18
-
19
-
20
-
21
-
22
-
23
-
24
-
25
-
26
-
27
-
28
-
29
-
30
-
31
-
32
-
33
-
34
-
35
-
36
-
37
-
38
-
39
-
40
-
41
-
42
-
43
-
44
-
45
-
46
-
47
-
48
-
49
-
50
-
51
-
52
-
53
-
54
-
55
-
56
-
57
-
58
-
59
-
60
-
61
-
62
-
63
-
64
-
65
-
 66
66 -
 67
67 -
 68
68 -
 69
69 -
 70
70 -
 71
71 -
 72
72 -
 73
73 -
 74
74 -
 75
75 -
 76
76 -
 77
77 -
 78
78 -
 79
79 -
 80
80 -
 81
81 -
 82
82 -
 83
83 -
 84
84 -
 85
85 -
 86
86 -
87
-
88
-
89
-
90
-
91
-
92
 |
 |

70
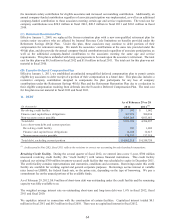
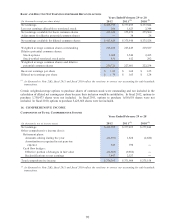
BASIC AND DILUTIVE NET EARNINGS PER SHARE RECONCILIATIONS
(In thousands except per share data)
Net earnings 413,795$ 377,495$ 277,844$
Less net earnings allocable to restricted stock 166 1,623 2,344
Net earnings available for bas ic common shares 413,629 375,872 275,500
Adjustment for dilutive potential common shares ʊ 38 28
Net earnings available for diluted common shares 413,629$ 375,910$ 275,528$
W eighted average common shares outs tanding 226,282 223,449 219,527
Dilutive potential common shares:
Stock options 3,608 3,540 2,415
Stock-settled restricted stock units 831 612 292
Weighted average common shares and dilutive
potential common s hares 230,721 227,601 222,234
Basic net earnings per share 1.83$ 1.68$ 1.25$
Diluted net earnings per share 1.79$ 1.65$ 1.24$
Years Ended February 29 or 28
2012 2011
(
1
)
2010
(
1
)
(1) As discussed in Note 2(K), fiscal 2011 and fiscal 2010 reflect the revisions to correct our accounting for sale-leaseback
transactions.
Certain weighted-average options to purchase shares of common stock were outstanding and not included in the
calculation of diluted net earnings per share because their inclusion would be antidilutive. In fiscal 2012, options to
purchase 1,750,473 shares were not included. In fiscal 2011, options to purchase 1,656,658 shares were not
included. In fiscal 2010, options to purchase 5,425,666 shares were not included.
14. COMPREHENSIVE INCOME
COMPONENTS OF TOTAL COMPREHENSIVE INCOME
(In thousands, net of income taxes)
Net earnings 413,795$ 377,495$ 277,844$
Other comprehensive income (loss):
Retirement plans:
Amounts arising during the year (22,591) 1,828 (2,686)
Amortization recognized in net pension
expense 345 190 ʊ
Cash flow hedges:
Effective portion of changes in fair value (22,603) (9,856) ʊ
Reclassifications to net earnings 7,447 2,327 ʊ
Total comprehensive income 376,393$ 371,984$ 275,158$
Year s Ende d Fe br uar y 2 9 or 2 8
2012 2011
(
1
)
2010
(
1
)
(1) As discussed in Note 2(K), fiscal 2011 and fiscal 2010 reflect the revisions to correct our accounting for sale-leaseback
transactions.