CarMax 2012 Annual Report Download - page 28
Download and view the complete annual report
Please find page 28 of the 2012 CarMax annual report below. You can navigate through the pages in the report by either clicking on the pages listed below, or by using the keyword search tool below to find specific information within the annual report.-
 1
1 -
2
-
3
-
4
-
5
-
6
-
7
-
8
-
9
-
10
-
11
-
12
-
13
-
14
-
15
-
16
-
17
-
 18
18 -
 19
19 -
 20
20 -
 21
21 -
 22
22 -
 23
23 -
 24
24 -
 25
25 -
 26
26 -
 27
27 -
 28
28 -
 29
29 -
 30
30 -
 31
31 -
 32
32 -
 33
33 -
 34
34 -
 35
35 -
 36
36 -
 37
37 -
 38
38 -
39
-
40
-
41
-
42
-
43
-
44
-
45
-
46
-
47
-
48
-
49
-
50
-
51
-
52
-
53
-
54
-
55
-
56
-
57
-
58
-
59
-
60
-
61
-
62
-
63
-
64
-
65
-
66
-
67
-
68
-
69
-
70
-
71
-
72
-
73
-
74
-
75
-
76
-
77
-
78
-
79
-
80
-
81
-
82
-
83
-
84
-
85
-
86
-
87
-
88
-
89
-
90
-
91
-
92
 |
 |
22
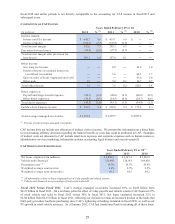
with lower-cost securitizations. The provision for loan losses increased to $36.4 million from $27.7 million in
fiscal 2011, reflecting the combination of the growth in average managed receivables and the cumulative effect
of the origination and retention of loans with higher risk, partly offset by favorable loss experience in fiscal
2012.
x Selling, general and administrative (“SG&A”) expenses rose 7% to $940.8 million from $878.8 million in fiscal
2011. The increase in SG&A was driven by expansion of our store base, higher growth-related costs, increases
in sales commissions and other variable costs, and higher advertising expense. Growth-related costs include
store pre-opening expenses, relocation expenses, and the costs of maintaining store management bench strength
to support future growth. SG&A per used unit rose 4% to $2,305 from $2,218 in fiscal 2011. SG&A expenses
as a percent of net sales and operating revenues (the “SG&A ratio”), fell to 9.4% from 9.8% in fiscal 2011
reflecting the leverage associated with the increases in used and wholesale vehicle sales, and average selling
prices.
x Net cash used in operating activities totaled $62.2 million in fiscal 2012 compared with $6.8 million in fiscal
2011. These amounts included increases in auto loan receivables of $675.7 million and $304.7 million,
respectively. The majority of the increases in auto loan receivables are accompanied by increases in non-
recourse notes payable, which are reflected as cash provided by financing activities.
CRITICAL ACCOUNTING POLICIES
Our results of operations and financial condition as reflected in the consolidated financial statements have been
prepared in accordance with U.S. generally accepted accounting principles. Preparation of financial statements
requires management to make estimates and assumptions affecting the reported amounts of assets, liabilities,
revenues, expenses and the disclosures of contingent assets and liabilities. We use our historical experience and
other relevant factors when developing our estimates and assumptions. We continually evaluate these estimates and
assumptions. Note 2 includes a discussion of significant accounting policies. The accounting policies discussed
below are the ones we consider critical to an understanding of our consolidated financial statements because their
application places the most significant demands on our judgment. Our financial results might have been different if
different assumptions had been used or other conditions had prevailed.
Financing and Securitization Transactions
We maintain a revolving securitization program comprised of two warehouse facilities (“warehouse facilities”) to
fund substantially all of the auto loan receivables originated by CAF until they can be funded through a term
securitization or alternative funding arrangement. As of March 1, 2010, we adopted Accounting Standards Update
(“ASU”) Nos. 2009-16 and 2009-17 on a prospective basis. Pursuant to these pronouncements, we now recognize
all transfers of auto loan receivables into either our warehouse facilities or term securitizations as secured
borrowings, which results in recording the auto loan receivables and the related non-recourse notes payable on our
consolidated balance sheets. Also pursuant to these pronouncements, beginning in fiscal 2011, CAF income
included in the consolidated statements of earnings no longer includes a gain on the sale of loans through
securitization transactions, but instead primarily reflects the interest and fee income associated with the auto loan
receivables less the interest expense associated with the debt issued to fund these receivables, direct CAF expenses
and a provision for estimated loan losses.
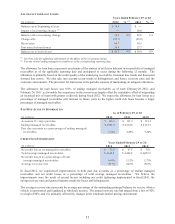
Auto loan receivables include amounts due from customers primarily related to used retail vehicle sales financed
through CAF and are presented net of an allowance for estimated loan losses. The allowance for loan losses
represents an estimate of the amount of net losses inherent in our portfolio of managed receivables as of the
applicable reporting date and anticipated to occur during the following 12 months. The allowance is primarily based
on the credit quality of the underlying receivables, historical loss trends and forecasted forward loss curves. We also
take into account recent trends in delinquencies and losses, recovery rates and the economic environment. The
provision for loan losses is the periodic expense of maintaining an adequate allowance.
See Notes 2(E), 2(H), 4 and 5 for additional information on auto loan receivables and securitizations.
Revenue Recognition
We recognize revenue when the earnings process is complete, generally either at the time of sale to a customer or
upon delivery to a customer. We recognize used vehicle revenue when a sales contract has been executed and the
vehicle has been delivered, net of a reserve for returns under our 5-day, money-back guarantee. A reserve for
vehicle returns is recorded based on historical experience and trends, and results could be affected if future vehicle
returns differ from historical averages.