Blackberry 2004 Annual Report Download - page 59
Download and view the complete annual report
Please find page 59 of the 2004 Blackberry annual report below. You can navigate through the pages in the report by either clicking on the pages listed below, or by using the keyword search tool below to find specific information within the annual report.-
 1
1 -
2
-
3
-
4
-
5
-
6
-
7
-
8
-
9
-
10
-
11
-
12
-
13
-
14
-
15
-
16
-
17
-
18
-
19
-
20
-
21
-
22
-
23
-
24
-
25
-
26
-
27
-
28
-
29
-
30
-
31
-
32
-
33
-
34
-
35
-
36
-
37
-
38
-
39
-
40
-
41
-
42
-
43
-
44
-
45
-
46
-
47
-
48
-
 49
49 -
 50
50 -
 51
51 -
 52
52 -
 53
53 -
 54
54 -
 55
55 -
 56
56 -
 57
57 -
 58
58 -
 59
59 -
 60
60 -
 61
61 -
 62
62
 |
 |

57
For the years ended February 28, 2004, March 1, 2003 and March 2, 2002
The Company is exposed to interest rate risk as a
result of holding investments of varying maturities.
The fair value of investments, as well as the
investment income derived from the investment
portfolio, will fluctuate with changes in prevailing
interest rates. The Company does not currently use
interest rate derivative financial instruments in its
investment portfolio.
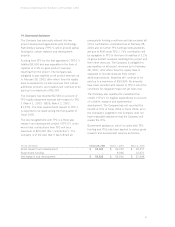
The Company, in the normal course of business,
monitors the financial condition of its customers
and reviews the credit history of each new customer.
The Company establishes an allowance for doubtful
accounts that corresponds to the specific credit risk
of its customers, historical trends and economic
circumstances. The allowance as at February 28, 2004
is $2,379 (March 1, 2003 - $2,331).
While the Company sells its products and services to
a variety of customers, two customers comprised
24%, and 10% of trade receivables as at February
28, 2004 (2003 - three customers comprised 17%,
16% and 14%). Additionally, two customers
comprised 15% and 13% of the Company’s sales
(March 1, 2003 - one customer comprised 12%).
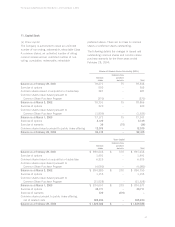
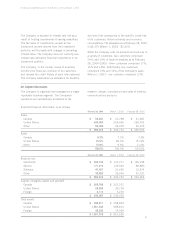
22. Segment Disclosures
The Company is organized and managed as a single
reportable business segment. The Company’s
operations are substantially all related to the
research, design, manufacture and sales of wireless
communications products.
Selected financial information is as follows:
February 28, 2004 March 1, 2003 February 28, 2002
Sales
Canada $54,847 $21,788 $21,381
United States 446,000 255,466 239,702
Other 93,769 29,478 32,970
$594,616 $ 306,732 $ 294,053
Sales
Canada 9.2% 7.1% 7.3%
United States 75.0% 83.3% 81.5%
Other 15.8% 9.6% 11.2%
100.0% 100.0% 100.0%
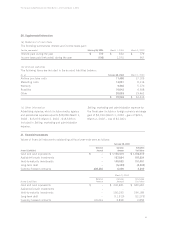
February 28, 2004 March 1, 2003 February 28, 2002
Revenue mix
Handhelds $343,154 $ 122,711 $ 160,198
Service 171,215 129,332 88,880
Software 47,427 21,655 12,874
Other 32,820 33,034 32,101
$ 594,616 $ 306,732 $ 294,053
Capital, intangible assets and goodwill
Canada $ 209,766 $ 207,221
United States 28,206 30,759
Foreign 4,115 5,270
$ 242,087 $ 243,250
Total assets
Canada $ 333,811 $ 258,833
United States 1,561,232 588,814
Foreign 36,335 14,009
$ 1,931,378 $ 861,656