Blackberry 2004 Annual Report Download - page 35
Download and view the complete annual report
Please find page 35 of the 2004 Blackberry annual report below. You can navigate through the pages in the report by either clicking on the pages listed below, or by using the keyword search tool below to find specific information within the annual report.-
 1
1 -
2
-
3
-
4
-
5
-
6
-
7
-
8
-
9
-
10
-
11
-
12
-
13
-
14
-
15
-
16
-
17
-
18
-
19
-
20
-
21
-
22
-
23
-
24
-
 25
25 -
 26
26 -
 27
27 -
 28
28 -
 29
29 -
 30
30 -
 31
31 -
 32
32 -
 33
33 -
 34
34 -
 35
35 -
 36
36 -
 37
37 -
 38
38 -
 39
39 -
 40
40 -
 41
41 -
 42
42 -
 43
43 -
 44
44 -
 45
45 -
46
-
47
-
48
-
49
-
50
-
51
-
52
-
53
-
54
-
55
-
56
-
57
-
58
-
59
-
60
-
61
-
62
 |
 |

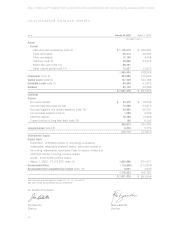
33
For the years ended February 28, 2004, March 1, 2003 and March 2, 2002
For the year ended February 28, 2004 March 1, 2003 March 2, 2002
US GAAP (note 1)
Cash flows from operating activities
Net income (loss) $51,829 $ (148,857) $ (28,321)
Items not requiring an outlay of cash:
Amortization 54,529 31,147 17,497
Deferred income taxes –29,244 (16,836)
Loss on disposal of capital assets 223 502 –
Loss (gain) on foreign currency translation
of long-term debt 859 (339) 4
Write-down of investments –– 5,350
Net changes in working capital items:
Trade receivables (54,410) 1,958 7,607
Other receivables (7,611) 1,473 7,918
Inventory(11,561) 6,202 30,567
Other current assets 512 (525) (3,467)
Accounts payable 16,976 7,059 1,834
Accrued liabilities 16,123 17,555 (2,333)
Accrued litigation and related expenses 33,690 50,702 –
Increase in restricted cash (36,261) – –
Income taxes payable (3,225) 2,106 (1,018)
Deferred revenue 2,162 4,563 (1,097)
63,835 2,790 17,705
Cash flows from financing activities
Issuance of share capital and warrants 994,640 1,155 1,491
Financing costs (39,629) ––
Buyback of common shares pursuant to
Common Share Purchase Program (note 11(a)) –(24,502) (5,525)
Repayment of debt (6,130) (614) (303)
948,881 (23,961) (4,337)
Cash flows from investing activities
Acquisition of investments (186,989) (190,030) –
Proceeds on sale or maturity of investments 43,746 ––
Acquisition of capital assets (21,815) (39,670) (73,917)
Acquisition of intangible assets (32,252) (30,997) (7,106)
Acquisition of subsidiaries (note 8) 478 (21,990) (9,709)
Acquisition of short-term investments (24,071) (41,900) (925,885)
Proceeds on sale and maturity of short-term investments 24,071 345,983 834,907
(196,832) 21,396 (181,710)
Foreign exchange effect on cash and cash equivalents (146) (20) (4)
Net increase (decrease) in cash and cash
equivalents for the year 815,738 205 (168,346)
Cash and cash equivalents, beginning of year 340,681 340,476 508,822
Cash and cash equivalents, end of year $ 1,156,419 $ 340,681 $ 340,476
See notes to the consolidated financial statements.
consolidated statement of cash flows