Blackberry 2004 Annual Report Download - page 16
Download and view the complete annual report
Please find page 16 of the 2004 Blackberry annual report below. You can navigate through the pages in the report by either clicking on the pages listed below, or by using the keyword search tool below to find specific information within the annual report.-
 1
1 -
2
-
3
-
4
-
5
-
 6
6 -
 7
7 -
 8
8 -
 9
9 -
 10
10 -
 11
11 -
 12
12 -
 13
13 -
 14
14 -
 15
15 -
 16
16 -
 17
17 -
 18
18 -
 19
19 -
 20
20 -
 21
21 -
 22
22 -
 23
23 -
 24
24 -
 25
25 -
 26
26 -
27
-
28
-
29
-
30
-
31
-
32
-
33
-
34
-
35
-
36
-
37
-
38
-
39
-
40
-
41
-
42
-
43
-
44
-
45
-
46
-
47
-
48
-
49
-
50
-
51
-
52
-
53
-
54
-
55
-
56
-
57
-
58
-
59
-
60
-
61
-
62
 |
 |

14
Research In Motion Limited • Incorporated Under the Laws of Ontario (In thousands of United States dollars, except per share data, and except as otherwise indicated)
Warranty
The Company provides for the estimated costs of
product warranties at the time revenue is
recognized. BlackBerry Handheld products are
generally covered by a time-limited warranty for
varying periods of time. The Company’s warranty
obligation is affected by product failure rates,
material usage and other related production costs
and service delivery expense.
The Company’s estimates of costs are based upon
historical experience and expectations of future
conditions when it is introducing new BlackBerry
Handheld products. To the extent that the Company
experiences increased warranty activity or increased
costs associated with servicing those obligations,
revisions to the estimated warranty liability would be
required.
Investments
Investments classified as available for sale under
SFAS 115 are carried at market value. Changes in
market values are accounted for through
accumulated other comprehensive income, until
such investments mature or are sold.
Investments with maturities in excess of one year
include those categorized as available-for-sale and
held-to-maturity for accounting purposes. The
Company does not exercise significant influence
with respect to any of these investments.
In the event that a decline in the fair value of a
held-to-maturity investment occurs and the decline
in value is considered to be other than temporary,
an appropriate write-down would be recorded.
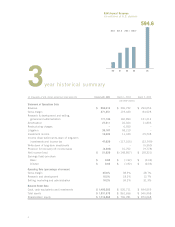
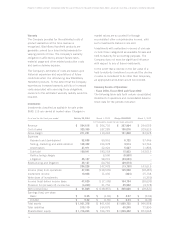
Summary Results of Operations
- Fiscal 2004, Fiscal 2003 and Fiscal 2002
The following table sets forth certain consolidated
statement of operations and consolidated balance
sheet data for the periods indicated:
As at and for the fiscal year ended February 28, 2004 March 1, 2003 Change 2004/2003 March 2, 2002
(in thousands, except for per share amounts)
Revenue $594,616 $306,732 $287,884 $294,053
Cost of sales 323,365 187,289 136,076 209,525
Gross margin 271,251 119,443 151,808 84,528
Expenses
Research and development 62,638 55,916 6,722 37,446
Selling, marketing and administration 108,492 104,978 3,514 93,766
Amortization 27,911 22,324 5,587 11,803
Sub-total 199,041 183,218 15,823 143,015
Restructuring charges –6,550 (6,550) –
Litigation 35,187 58,210 (23,023) –
Restructuring and litigation 35,187 64,760 (29,573) –
234,228 247,978 (13,750) 143,015
Income (loss) from operations 37,023 (128,535) 165,558 (58,487)
Investment income 10,606 11,430 (824) 25,738
Write-down of investments –––(5,350)
Income (loss) before income taxes 47,629 (117,105) 164,734 (38,099)
Provision for (recovery of) income tax (4,200) 31,752 35,952 (9,778)
Net income (loss) $ 51,829 $ (148,857) $ 200,686 $ (28,321)
Earnings (loss) per share
Basic $0.65 $(1.92) $2.57 $(0.36)
Diluted $ 0.62 $ (1.92) $ 2.54 $ (0.36)
Total assets $ 1,931,378 $ 861,656 $ 1,069,722 $ 946,958
Total liabilities 215,115 154,875 60,240 72,890
Shareholders’ equity $ 1,716,263 $ 706,781 $ 1,009,482 $ 874,068