Blackberry 2004 Annual Report Download - page 25
Download and view the complete annual report
Please find page 25 of the 2004 Blackberry annual report below. You can navigate through the pages in the report by either clicking on the pages listed below, or by using the keyword search tool below to find specific information within the annual report.-
 1
1 -
2
-
3
-
4
-
5
-
6
-
7
-
8
-
9
-
10
-
11
-
12
-
13
-
14
-
 15
15 -
 16
16 -
 17
17 -
 18
18 -
 19
19 -
 20
20 -
 21
21 -
 22
22 -
 23
23 -
 24
24 -
 25
25 -
 26
26 -
 27
27 -
 28
28 -
 29
29 -
 30
30 -
 31
31 -
 32
32 -
 33
33 -
 34
34 -
 35
35 -
36
-
37
-
38
-
39
-
40
-
41
-
42
-
43
-
44
-
45
-
46
-
47
-
48
-
49
-
50
-
51
-
52
-
53
-
54
-
55
-
56
-
57
-
58
-
59
-
60
-
61
-
62
 |
 |

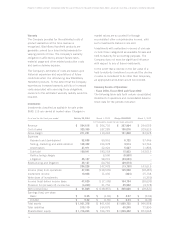
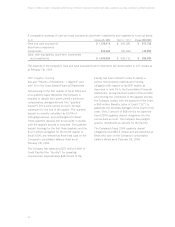
23
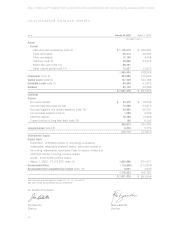
For the years ended February 28, 2004, March 1, 2003 and March 2, 2002
Liquidity and Capital Resources
Summary of Cash Flows
The following table summarizes the Company’s cash flows for the periods indicated:
Fiscal 2004 Fiscal 2003
Net income (loss) $ 51,829 $(148,857)
Amortization 54,529 31,147
Deferred income taxes –29,244
Working capital and other (42,523) 91,256
Cash flows from operating activities 63,835 2,790
Cash flows from financing activities 948,881 (23,961)
Cash flows from investing activities (196,832) 21,396
Other (146) (20)
Net increase in cash and cash equivalents $ 815,738 $ 205
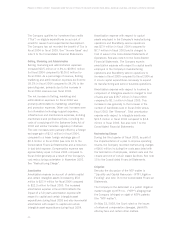
Operating Activities
For fiscal 2004, cash flow generated from operating
activities was $63.8 million compared to $2.8 million
in fiscal 2003. Net income plus amortization was
$106.4 million for the current year. The majority of
cash applied to cash working capital for the current
fiscal year resulted from increases in trade
receivables of $54.4 million (generally consistent
with the Company’s revenue growth), other receivables
of $7.6 million and inventory of $11.6 million.
These increases were partially offset by an increase
in accounts payable of $17.0 million and accrued
liabilities of $16.1 million. The increase in accrued
litigation of $33.7 million is more than offset by the
increase in restricted cash of $36.3 million, which
relates to the Company’s funding requirement to
deposit funds into an escrow account with respect
to the NTP matter. See “NTP Litigation Funding”.
Financing Activities
During fiscal 2004, cash flow generated from
financing activities was $948.9 million including
$905.2 million in net proceeds from the Company’s
public offering of 12.1 million shares at $78.25 per
share, and $49.8 million of proceeds upon the
issuance of share capital related to the exercise of
stock options. The Company repaid $6.1 million of
debt in fiscal 2004. This compares to $24.0 million
used in financing activities in the prior fiscal year,
which was primarily for the buyback of 1.9 million
common shares pursuant to the Company’s Common
Share Purchase Program.
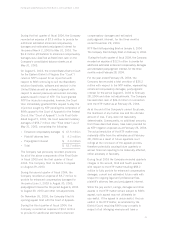
Investing Activities
For the current fiscal year, cash flow used for
investing activities equalled $196.8 million, which
included the acquisition of investments, net of
proceeds on disposition, of $143.2 million, and the
acquisitions of capital assets and intangible assets
of $21.8 million and $32.3 million, respectively.
For the prior fiscal year, cash flow generated by
investing activities was $21.4 million. Uses
included the acquisition of investments of $190.0
million, acquisitions of capital assets and intangible
assets of $39.7 million and $31.0 million,
respectively, and acquisitions of subsidiaries of
$22.0 million. There were net proceeds from the
sale of investments of $304.1 million.
Cash and cash equivalents, short-term investments
and investments increased by $959.6 million to
$1,490.3 million as at February 28, 2004 from
$530.7 million as at March 1, 2003.