Blackberry 2004 Annual Report Download - page 56
Download and view the complete annual report
Please find page 56 of the 2004 Blackberry annual report below. You can navigate through the pages in the report by either clicking on the pages listed below, or by using the keyword search tool below to find specific information within the annual report.-
 1
1 -
2
-
3
-
4
-
5
-
6
-
7
-
8
-
9
-
10
-
11
-
12
-
13
-
14
-
15
-
16
-
17
-
18
-
19
-
20
-
21
-
22
-
23
-
24
-
25
-
26
-
27
-
28
-
29
-
30
-
31
-
32
-
33
-
34
-
35
-
36
-
37
-
38
-
39
-
40
-
41
-
42
-
43
-
44
-
45
-
 46
46 -
 47
47 -
 48
48 -
 49
49 -
 50
50 -
 51
51 -
 52
52 -
 53
53 -
 54
54 -
 55
55 -
 56
56 -
 57
57 -
 58
58 -
 59
59 -
 60
60 -
 61
61 -
 62
62
 |
 |

54
Research In Motion Limited • Incorporated Under the Laws of Ontario (In thousands of United States dollars, except per share data, and except as otherwise indicated)
17. Write-Down of Investments
Periodically the Company undertakes a review of
the carrying value of companies in which it holds
investments. Based on such reviews, the Company
determines whether impairment in the carrying
values of its investments has occurred. The Company
further determines whether such declines are other
than temporary in nature. The Company wrote down
the value of its investments in fiscal 2002 by $5,350.
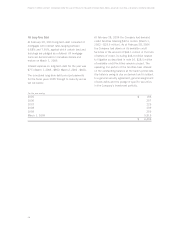
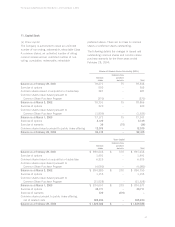
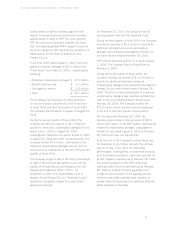
18. Earnings (Loss) Per Share
The following table sets forth the computation of basic and diluted earnings (loss) per share.
For the year ended February 28, 2004 March 1, 2003 March 2, 2002
Numerator for basic and diluted earnings (loss)
per share available to common stockholders $51,829 $ (148,857) $ (28,321)
Denominator for basic earnings (loss) per share
- weighted average shares outstanding (000’s) 79,650 77,636 78,467
Effect of dilutive securities:
Employee stock options 4,040 ––
Denominator for basic and diluted earnings
(loss) per share - weighted average shares
outstanding (000’s) 83,690 77,636 78,467
Earnings (loss) per share
Basic $ 0.65 $ (1.92) $ (0.36)
Diluted $0.62 $ (1.92) $ (0.36)
Stock options and share purchase warrants were excluded from the diluted (loss) per share figures for 2003
and 2002, as they were anti-dilutive.
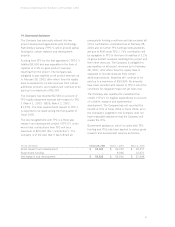
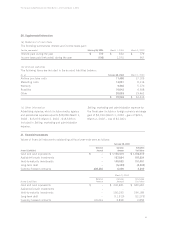
19. Comprehensive Income (Loss)
The components of comprehensive net income (loss) are shown in the following table:
For the year ended February 28, 2004 March 1, 2003 March 2, 2002
Net income (loss) $ 51,829 $ (148,857) $ (28,321)
Net change in unrealized gains on available for sale 613 ––
Net change in derivative fair value during the year 11,941 5,958 (2,803)
Amounts reclassified to earnings during the year (9,912) (1,041) 1,325
Comprehensive income (loss) $54,471 $(143,940) $(29,799)
The components of accumulated other comprehensive income are as follows:
For the year ended February 28, 2004 March 1, 2003 March 2, 2002
Accumulated net unrealized gains on available-for-sale $ 613 $ – $ –
Accumulated net unrealized gains (loss) on derivative
instruments 5,468 3,439 (1,478)
Total accumulated other comprehensive income (loss) $ 6,081 $ 3,439 $ (1,478)