Blackberry 2004 Annual Report Download - page 24
Download and view the complete annual report
Please find page 24 of the 2004 Blackberry annual report below. You can navigate through the pages in the report by either clicking on the pages listed below, or by using the keyword search tool below to find specific information within the annual report.-
 1
1 -
2
-
3
-
4
-
5
-
6
-
7
-
8
-
9
-
10
-
11
-
12
-
13
-
 14
14 -
 15
15 -
 16
16 -
 17
17 -
 18
18 -
 19
19 -
 20
20 -
 21
21 -
 22
22 -
 23
23 -
 24
24 -
 25
25 -
 26
26 -
 27
27 -
 28
28 -
 29
29 -
 30
30 -
 31
31 -
 32
32 -
 33
33 -
 34
34 -
35
-
36
-
37
-
38
-
39
-
40
-
41
-
42
-
43
-
44
-
45
-
46
-
47
-
48
-
49
-
50
-
51
-
52
-
53
-
54
-
55
-
56
-
57
-
58
-
59
-
60
-
61
-
62
 |
 |

22
Research In Motion Limited • Incorporated Under the Laws of Ontario (In thousands of United States dollars, except per share data, and except as otherwise indicated)
material adverse effect on RIM’s future results of
operations and financial condition. In addition, if
RIM is not able to overturn on the appeal the
injunction, it may be unable to continue to provide
BlackBerry service in the United States and to
continue to use, sell or manufacture its wireless
handhelds and software in, or to import them into,
the United States, which is the largest market for
RIM’s products and services, unless RIM is able
to negotiate a license with NTP at that time, which
may not be available to RIM at a reasonable cost
or at all.
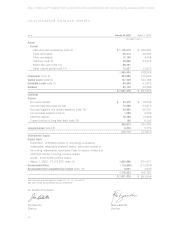
Investment Income
Investment income decreased to $10.6 million in
fiscal 2004 from $11.4 million in fiscal 2003. The
decrease primarily reflects a reduction in the
average interest rate yield on the investment
portfolio during fiscal 2004 compared to fiscal
2003. Investment income increased for the period
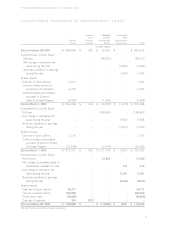
January 21, 2004 to February 28, 2004 as a result
of the Company’s equity offering of 12.1 million
shares, which raised net proceeds of $905.2 million
that were invested for that period.
The Company expects its investment income to
increase in fiscal 2005 compared to fiscal 2004 as
a result of the inclusion of the $905.2 million in
the Company’s fiscal 2005 investment portfolio for
the entire 2005 fiscal year.
Income Taxes
The Company recorded a current tax recovery of
$4.2 million or $0.05 per share diluted in the
fourth quarter of fiscal 2004 to reflect the
resolution of certain tax uncertainties previously
provided for.
The Company recorded nil deferred income tax
expense in fiscal 2004 as the Company’s income
tax expense with respect to pre-tax income earned
was offset by the utilization of previously
unrecognized deferred tax assets. The Company
maintained its previous determination that we still
did not meet the “more likely than not” standard
under U.S. and Canadian GAAP with respect to the
realization of its deferred income tax asset balance
and that a full valuation allowance is required as at
February 28, 2004.
For fiscal 2003, during the third quarter, the
Company determined that it was no longer able to
satisfy the “more likely than not” standard with
respect to the realization of its deferred income tax
asset balance. Consequently, the Company recorded
an increase in its valuation allowance at the time,
resulting then in a net provision for deferred income
tax of $37.9 million. These net deferred tax assets
have a substantially unlimited life and remain
available for use against taxes on future profits. The
Company will continue to evaluate and examine the
valuation allowance on a regular basis and as
uncertainties are resolved, the valuation allowance
may be adjusted accordingly. See also Note 9 to the
Consolidated Financial Statements.
The Company has not provided for Canadian income
taxes or foreign withholding taxes that would apply
on the distribution of the earnings of its non-
Canadian subsidiaries, as these earnings are
intended to be reinvested indefinitely by these
subsidiaries.
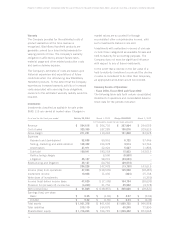
Net Income (Loss)
Net income was $51.8 million, or $0.65 per share
basic and $0.62 per share diluted, in fiscal 2004
versus a net loss of $148.9 million, or $1.92 per
share basic and diluted, in the prior year. See
“Executive Summary” for an analysis and
reconciliation of the fiscal 2004 increase in net
income and earnings per share.