Blackberry 2004 Annual Report Download - page 17
Download and view the complete annual report
Please find page 17 of the 2004 Blackberry annual report below. You can navigate through the pages in the report by either clicking on the pages listed below, or by using the keyword search tool below to find specific information within the annual report.-
 1
1 -
2
-
3
-
4
-
5
-
6
-
 7
7 -
 8
8 -
 9
9 -
 10
10 -
 11
11 -
 12
12 -
 13
13 -
 14
14 -
 15
15 -
 16
16 -
 17
17 -
 18
18 -
 19
19 -
 20
20 -
 21
21 -
 22
22 -
 23
23 -
 24
24 -
 25
25 -
 26
26 -
 27
27 -
28
-
29
-
30
-
31
-
32
-
33
-
34
-
35
-
36
-
37
-
38
-
39
-
40
-
41
-
42
-
43
-
44
-
45
-
46
-
47
-
48
-
49
-
50
-
51
-
52
-
53
-
54
-
55
-
56
-
57
-
58
-
59
-
60
-
61
-
62
 |
 |

15
For the years ended February 28, 2004, March 1, 2003 and March 2, 2002
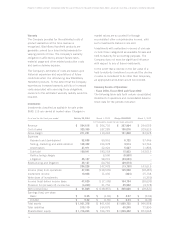
The following table sets forth certain consolidated statement of operations data expressed as a percentage of
revenue for the periods indicated:
Fiscal year ended February 28, 2004 March 1, 2003 Change 2004/2003 March 2, 2002
Revenue 100.0% 100.0% –100.0%
Cost of sales 54.4% 61.1% (6.7%) 71.3%
Gross margin 45.6% 38.9% 6.7% 28.7%
Expenses
Research and development 10.5% 18.2% (7.7%) 12.7%
Selling, marketing and administration 18.2% 34.2% (16.0%) 31.9%
Amortization 4.8% 7.3% (2.5%) 4.0%
Sub-total 33.5% 59.7% (26.2%) 48.6%
Restructuring charges –2.1% (2.1%) –
Litigation 5.9% 19.0% (13.1%) –
Restructuring and litigation 5.9% 21.1% (15.2%) –
39.4% 80.8% (41.4%) 48.6%
Income (loss) from operations 6.2% (41.9%) 48.1% (19.9%)
Investment income 1.8% 3.7% (1.9%) 8.8%
Write-down of investments –––(1.8%)
Income (loss) before income taxes 8.0% (38.2%) 46.2% (12.9%)
Provision for (recovery of) income tax (0.7%) 10.3% 11.0% (3.3%)
Net income (loss) 8.7% (48.5%) 57.2% (9.6%)
Executive Summary
As the above tables highlight, the Company’s results
were significantly improved in fiscal 2004 compared
to fiscal 2003. The four primary fiscal 2004 “profit
drivers” that contributed to this improvement are
discussed below. A more comprehensive analysis of
these factors is contained in “Results of
Operations”.
The Company’s net income increased by $200.7
million to $51.8 million or $0.65 basic earnings per
share and $0.62 diluted earnings per share in fiscal
2004, compared to a net loss of $148.9 million or
a loss per share of $1.92 in fiscal 2003.
Primary Fiscal 2004 Profit Drivers
Revenue and resulting gross margin growth
Revenue increased by $287.9 million to $594.6
million in fiscal 2004 from $306.7 million in the
preceding year. The number of BlackBerry
handhelds sold increased by 643,000 to 920,000
in fiscal 2004 compared to 277,000 in fiscal
2003. Factoring in a 15.8% reduction in average
selling price (“ASP”), handheld revenues increased
by $220.4 million to $343.2 million in fiscal 2004.
Service revenue increased by $41.9 million to
$171.2 million in fiscal 2004, consistent with the
Company’s increase in BlackBerry subscribers
during the year. Software revenue increased by
$25.8 million to $47.4 million in fiscal 2004.
Gross margin increased to $271.3 million or 45.6%
in fiscal 2004 compared to $119.4 million or
38.9% in fiscal 2003. The increase of 6.7% in the
gross margin ratio to 45.6% in fiscal 2004 was as a
result of the Company’s cost reduction efforts for its
BlackBerry handhelds and service revenue streams,
increased manufacturing cost efficiencies as a result
of the increase in handheld volumes and favorable
changes in BlackBerry handheld product mix.
Research and development, Selling, marketing and
administration and Amortization
The Company was focused on prudent cost
management and maximizing the financial net
income “leverage” to be obtained from the increase
in revenue and gross margin. Research and
development, Selling, marketing and administration
and Amortization expenses increased by $15.8