Blackberry 2004 Annual Report Download - page 57
Download and view the complete annual report
Please find page 57 of the 2004 Blackberry annual report below. You can navigate through the pages in the report by either clicking on the pages listed below, or by using the keyword search tool below to find specific information within the annual report.-
 1
1 -
2
-
3
-
4
-
5
-
6
-
7
-
8
-
9
-
10
-
11
-
12
-
13
-
14
-
15
-
16
-
17
-
18
-
19
-
20
-
21
-
22
-
23
-
24
-
25
-
26
-
27
-
28
-
29
-
30
-
31
-
32
-
33
-
34
-
35
-
36
-
37
-
38
-
39
-
40
-
41
-
42
-
43
-
44
-
45
-
46
-
 47
47 -
 48
48 -
 49
49 -
 50
50 -
 51
51 -
 52
52 -
 53
53 -
 54
54 -
 55
55 -
 56
56 -
 57
57 -
 58
58 -
 59
59 -
 60
60 -
 61
61 -
 62
62
 |
 |

55
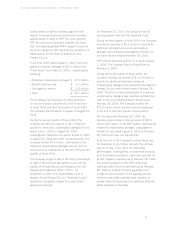
For the years ended February 28, 2004, March 1, 2003 and March 2, 2002
20. Supplemental Information
(a) Statement of cash flows
The following summarizes interest and income taxes paid:
For the year ended February 28, 2004 March 1, 2003 March 2, 2002
Interest paid during the year $ 770 $ 852 $ 779
Income taxes paid (refunded) during the year (196) 1,070 967
(b) Accrued liabilities
The following items are included in the accrued liabilities balance:
As at February 28, 2004 March 1, 2003
Airtime purchase costs 17,486 17,109
Marketing costs 13,081 8,116
Warranty 9,246 5,170
Royalties 10,042 4,558
Other 20,683 19,462
$ 70,538 $ 54,415
(c) Other information
Advertising expense, which includes media, agency
and promotional expenses equal to $18,206 (March 1,
2003 - $15,079; March 2, 2002 - $18,549) is
included in Selling, marketing and administration
expense.
Selling, marketing and administration expense for
the fiscal year includes a foreign currency exchange
gain of $2,156 (March 1, 2003 – gain of $293;
March 2, 2002 – loss of $1,042).
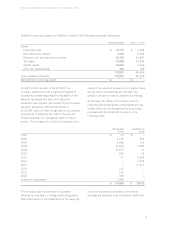
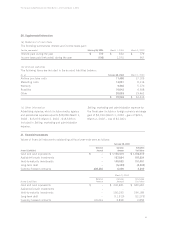
21. Financial Instruments
Values of financial instruments outstanding at fiscal year-ends were as follows:
February 28, 2004
Notional Carrying Estimated
Assets (Liabilities) Amount Amount Fair Value
Cash and cash equivalents $ – $ 1,156,419 $ 1,156,419
Available-for-sale investments – 187,824 187,824
Held-to-maturity investments –146,062 151,461
Long-term debt – (6,433) (6,808)
Currency forward contracts 208,850 5,399 5,399
March 2, 2003
Notional Carrying Estimated
Assets (Liabilities) Amount Amount Fair Value
Cash and cash equivalents $ – $ 340,681 $ 340,681
Available-for-sale investments – – –
Held-to-maturity investments – 190,030 194,189
Long-term debt – (11,919) (12,273)
Currency forward contracts 69,416 3,858 3,858