BMW 2007 Annual Report Download - page 98
Download and view the complete annual report
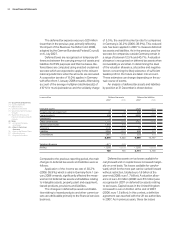
Please find page 98 of the 2007 BMW annual report below. You can navigate through the pages in the report by either clicking on the pages listed below, or by using the keyword search tool below to find specific information within the annual report.-
 1
1 -
2
-
3
-
4
-
5
-
6
-
7
-
8
-
9
-
10
-
11
-
12
-
13
-
14
-
15
-
16
-
17
-
18
-
19
-
20
-
21
-
22
-
23
-
24
-
25
-
26
-
27
-
28
-
29
-
30
-
31
-
32
-
33
-
34
-
35
-
36
-
37
-
38
-
39
-
40
-
41
-
42
-
43
-
44
-
45
-
46
-
47
-
48
-
49
-
50
-
51
-
52
-
53
-
54
-
55
-
56
-
57
-
58
-
59
-
60
-
61
-
62
-
63
-
64
-
65
-
66
-
67
-
68
-
69
-
70
-
71
-
72
-
73
-
74
-
75
-
76
-
77
-
78
-
79
-
80
-
81
-
82
-
83
-
84
-
85
-
86
-
87
-
 88
88 -
 89
89 -
 90
90 -
 91
91 -
 92
92 -
 93
93 -
 94
94 -
 95
95 -
 96
96 -
 97
97 -
 98
98 -
 99
99 -
 100
100 -
 101
101 -
 102
102 -
 103
103 -
 104
104 -
 105
105 -
 106
106 -
 107
107 -
 108
108 -
109
-
110
-
111
-
112
-
113
-
114
-
115
-
116
-
117
-
118
-
119
-
120
-
121
-
122
-
123
-
124
-
125
-
126
-
127
-
128
-
129
-
130
-
131
-
132
-
133
-
134
-
135
-
136
-
137
-
138
-
139
-
140
-
141
-
142
-
143
-
144
-
145
-
146
-
147
-
148
-
149
-
150
-
151
-
152
-
153
-
154
-
155
-
156
-
157
-
158
-
159
-
160
-
161
-
162
-
163
-
164
-
165
-
166
-
167
-
168
-
169
-
170
-
171
-
172
-
173
-
174
-
175
-
176
-
177
-
178
-
179
-
180
-
181
-
182
-
183
-
184
-
185
-
186
-
187
-
188
-
189
-
190
-
191
-
192
-
193
-
194
-
195
-
196
-
197
-
198
-
199
-
200
-
201
-
202
-
203
-
204
-
205
-
206
-
207
-
208
-
209
-
210
-
211
-
212
-
213
-
214
-
215
-
216
-
217
-
218
-
219
-
220
-
221
-
222
-
223
-
224
-
225
-
226
-
227
-
228
-
229
-
230
-
231
-
232
-
233
-
234
-
235
-
236
-
237
-
238
-
239
-
240
-
241
-
242
-
243
-
244
-
245
-
246
-
247
 |
 |

96 Group Financial Statements
73 Group Financial Statements
73 Income Statements
74 Balance Sheets
76 Cash Flow Statements
78 Group Statement of Changes
in Equity
79 Statement of Income and
Expenses recognised directly
in Equity
80 Notes
80 – Accounting Principles
and Policies
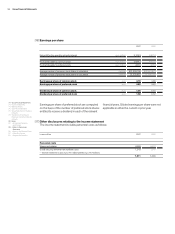
89 – Notes to the Income
Statement
96 – Notes to the Balance Sheet
117 – Other Disclosures
131 – Segment Information
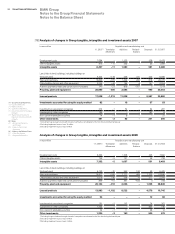
Analysis of changes in Group tangible, intangible and investment assets 2006
in euro million Acquisition and manufacturing cost
1.1.20061] Translation Additions Reclassi- Disposals 31.12.2006
differences fications
1] including the gross balances brought forward of companies consolidated for the first time during the financial year
2] including impairment losses of euro 8 million
3] including impairment losses of euro 7 million
Development costs 6,593 – 1,536 – 445 7,684
Other intangible assets 739 – 5 121 – 56 799
Intangible assets 7,332 – 5 1,657 – 501 8,483
Land, titles to land, buildings, including buildings on
third party land 6,150 – 70 242 152 49 6,425
Plant and machinery 18,977 – 185 1,717 464 1,333 19,640
Other facilities, factory and office equipment 2,078 – 46 206 16 211 2,043
Advance payments made and construction in progress 899 – 15 491 – 632 3 740
Property, plant and equipment 28,104 – 316 2,656 – 1,596 28,848
Leased products 13,983 – 1,182 8,522 – 4,578 16,745
Investments accounted for using the equity method 94 – – – 12 82
Investments in associated companies 191 – 2 152 – 74 267
Investments in other companies 1,002 – – – 807 195
Non-current marketable securities 32 – 1 11 – 28 14
Other investments 1,225 – 3 163 – 909 476
BMW Group
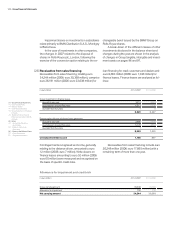
Notes to the Group Financial Statements
Notes to the Balance Sheet
[18]Analysis of changes in Group tangible, intangible and investment assets 2007
in euro million Acquisition and manufacturing cost
1.1.20071] Translation Additions Reclassi- Disposals 31.12.2007
differences fications
Development costs 7,684 – 1,333 – 538 8,479
Other intangible assets 813 – 11 250 – 43 1,009
Intangible assets 8,497 – 11 1,583 – 581 9,488
Land, titles to land, buildings, including buildings on
third party land 6,425 – 118 248 231 220 6,566
Plant and machinery 19,640 – 315 1,444 264 618 20,415
Other facilities, factory and office equipment 2,055 – 44 184 6 147 2,054
Advance payments made and construction in progress 740 – 23 808 – 501 5 1,019
Property, plant and equipment 28,860 – 500 2,684 – 990 30,054
Leased products 17,628 – 1,219 11,038 – 6,587 20,860
Investments accounted for using the equity method 82 – 18 – 37 63
Investments in associated companies 272 – 1 54 – 64 261
Investments in other companies 195 – – – 187 8
Non-current marketable securities 14 – 1 8 – – 21
Other investments 481 – 2 62 – 251 290
1] including the gross balances brought forward of companies consolidated for the first time during the financial year
2] including impairment losses of euro 12 million
3] including impairment losses of euro 5 million