BMW 2007 Annual Report Download - page 50
Download and view the complete annual report
Please find page 50 of the 2007 BMW annual report below. You can navigate through the pages in the report by either clicking on the pages listed below, or by using the keyword search tool below to find specific information within the annual report.-
 1
1 -
2
-
3
-
4
-
5
-
6
-
7
-
8
-
9
-
10
-
11
-
12
-
13
-
14
-
15
-
16
-
17
-
18
-
19
-
20
-
21
-
22
-
23
-
24
-
25
-
26
-
27
-
28
-
29
-
30
-
31
-
32
-
33
-
34
-
35
-
36
-
37
-
38
-
39
-
 40
40 -
 41
41 -
 42
42 -
 43
43 -
 44
44 -
 45
45 -
 46
46 -
 47
47 -
 48
48 -
 49
49 -
 50
50 -
 51
51 -
 52
52 -
 53
53 -
 54
54 -
 55
55 -
 56
56 -
 57
57 -
 58
58 -
 59
59 -
 60
60 -
61
-
62
-
63
-
64
-
65
-
66
-
67
-
68
-
69
-
70
-
71
-
72
-
73
-
74
-
75
-
76
-
77
-
78
-
79
-
80
-
81
-
82
-
83
-
84
-
85
-
86
-
87
-
88
-
89
-
90
-
91
-
92
-
93
-
94
-
95
-
96
-
97
-
98
-
99
-
100
-
101
-
102
-
103
-
104
-
105
-
106
-
107
-
108
-
109
-
110
-
111
-
112
-
113
-
114
-
115
-
116
-
117
-
118
-
119
-
120
-
121
-
122
-
123
-
124
-
125
-
126
-
127
-
128
-
129
-
130
-
131
-
132
-
133
-
134
-
135
-
136
-
137
-
138
-
139
-
140
-
141
-
142
-
143
-
144
-
145
-
146
-
147
-
148
-
149
-
150
-
151
-
152
-
153
-
154
-
155
-
156
-
157
-
158
-
159
-
160
-
161
-
162
-
163
-
164
-
165
-
166
-
167
-
168
-
169
-
170
-
171
-
172
-
173
-
174
-
175
-
176
-
177
-
178
-
179
-
180
-
181
-
182
-
183
-
184
-
185
-
186
-
187
-
188
-
189
-
190
-
191
-
192
-
193
-
194
-
195
-
196
-
197
-
198
-
199
-
200
-
201
-
202
-
203
-
204
-
205
-
206
-
207
-
208
-
209
-
210
-
211
-
212
-
213
-
214
-
215
-
216
-
217
-
218
-
219
-
220
-
221
-
222
-
223
-
224
-
225
-
226
-
227
-
228
-
229
-
230
-
231
-
232
-
233
-
234
-
235
-
236
-
237
-
238
-
239
-
240
-
241
-
242
-
243
-
244
-
245
-
246
-
247
 |
 |

48 Group Management Report
10 Group Management Report
10 A Review of the Financial Year
13 General Economic Environment
17 Review of Operations
41 BMW Stock and Bonds
44 Disclosures relating to Takeover
Regulations and Explanatory Report
47 Financial Analysis
47 – Internal Management System
49 – Earnings Performance
51 – Financial Position
52 – Net Assets Position
55 – Subsequent Events Report
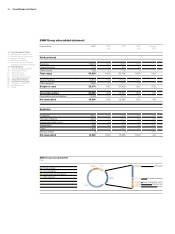
55 – Value Added Statement
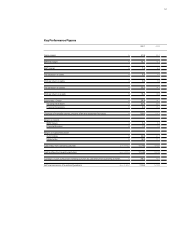
57 – Key Performance Figures
58 – Comments on BMW AG
62 Risk Management
68 Outlook
monitor and manage periodic targets on a long-term
basis in order to ensure that the BMW Group’s earn-
ings
performance can develop at a steady pace.
Periodic performance is managed in the light of de-
fined accounting policies and external financial re-
porting requirements. The BMW Group primarily
uses profit before tax and segment-specific rates of
return as the key indicator figures by which it manages
operating performance.
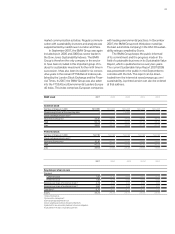
For example, return on capital employed is used
as the main performance indicator for the Automo-
biles and Motorcycles segments. Return on sales is
also used as a performance indicator. The return on
assets is used for the Group as a whole. In addition
to the return on assets, the Financial Services seg-
ment also manages its business using risk-based
performance indicators such as value-at-risk.
ROCE = Profit before financial result
Capital employed
ROA Group = Profit before interest expense and taxes
Balance sheet total
ROA Financial Services = Profit before tax
Operating assets
The ROCE is derived by dividing segment operat-
ing profit by segment capital employed. The latter
comprises all current and non-current operational
assets of the segment, less liabilities used opera-
tionally and which are not subject to interest e.g.
trade payables. This net amount is the capital em-
ployed.
The ROCE target value for the Automobiles
segment (i.e. the minimum required rate of return
derived from the cost of capital) is at least 26 %.
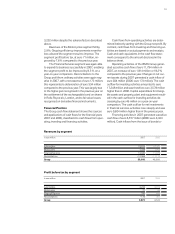
Key performance indicators 2007 2006 2005 2004* 2003
in %
*adjusted for new accounting treatment of pension obligations
Return on Capital Employed
Automobiles 22.8 21.7 23.2 25.4 23.8
Motorcycles 18.2 17.7 17.8 10.4 16.7
Return on Assets
Financial Services 1.3 1.4 1.3 1.4 1.4
BMW Group 5.3 6.3 5.6 6.5 6.6
Return on Assets Profit before tax / Profit before Operating assets / Return on Assets
interest expense and taxes Total assets
in euro million in euro million in %
2007 2006 2007 2006 2007 2006
Financial Services 743 685 59,040 50,529 1.3 1.4
BMW Group 4,721 4,979 88,997 79,057 5.3 6.3
Capital employed by 2007 2006
automobiles segment
in euro million
Assets employed 28,515 27,227
less: Non-interest bearing liabilities – 13,407 – 13,171
Capital employed 15,108 14,056