BMW 2007 Annual Report Download - page 124
Download and view the complete annual report
Please find page 124 of the 2007 BMW annual report below. You can navigate through the pages in the report by either clicking on the pages listed below, or by using the keyword search tool below to find specific information within the annual report.-
 1
1 -
2
-
3
-
4
-
5
-
6
-
7
-
8
-
9
-
10
-
11
-
12
-
13
-
14
-
15
-
16
-
17
-
18
-
19
-
20
-
21
-
22
-
23
-
24
-
25
-
26
-
27
-
28
-
29
-
30
-
31
-
32
-
33
-
34
-
35
-
36
-
37
-
38
-
39
-
40
-
41
-
42
-
43
-
44
-
45
-
46
-
47
-
48
-
49
-
50
-
51
-
52
-
53
-
54
-
55
-
56
-
57
-
58
-
59
-
60
-
61
-
62
-
63
-
64
-
65
-
66
-
67
-
68
-
69
-
70
-
71
-
72
-
73
-
74
-
75
-
76
-
77
-
78
-
79
-
80
-
81
-
82
-
83
-
84
-
85
-
86
-
87
-
88
-
89
-
90
-
91
-
92
-
93
-
94
-
95
-
96
-
97
-
98
-
99
-
100
-
101
-
102
-
103
-
104
-
105
-
106
-
107
-
108
-
109
-
110
-
111
-
112
-
113
-
 114
114 -
 115
115 -
 116
116 -
 117
117 -
 118
118 -
 119
119 -
 120
120 -
 121
121 -
 122
122 -
 123
123 -
 124
124 -
 125
125 -
 126
126 -
 127
127 -
 128
128 -
 129
129 -
 130
130 -
 131
131 -
 132
132 -
 133
133 -
 134
134 -
135
-
136
-
137
-
138
-
139
-
140
-
141
-
142
-
143
-
144
-
145
-
146
-
147
-
148
-
149
-
150
-
151
-
152
-
153
-
154
-
155
-
156
-
157
-
158
-
159
-
160
-
161
-
162
-
163
-
164
-
165
-
166
-
167
-
168
-
169
-
170
-
171
-
172
-
173
-
174
-
175
-
176
-
177
-
178
-
179
-
180
-
181
-
182
-
183
-
184
-
185
-
186
-
187
-
188
-
189
-
190
-
191
-
192
-
193
-
194
-
195
-
196
-
197
-
198
-
199
-
200
-
201
-
202
-
203
-
204
-
205
-
206
-
207
-
208
-
209
-
210
-
211
-
212
-
213
-
214
-
215
-
216
-
217
-
218
-
219
-
220
-
221
-
222
-
223
-
224
-
225
-
226
-
227
-
228
-
229
-
230
-
231
-
232
-
233
-
234
-
235
-
236
-
237
-
238
-
239
-
240
-
241
-
242
-
243
-
244
-
245
-
246
-
247
 |
 |

122 Group Financial Statements
73 Group Financial Statements
73 Income Statements
74 Balance Sheets
76 Cash Flow Statements
78 Group Statement of Changes
in Equity
79 Statement of Income and
Expenses recognised directly
in Equity
80 Notes
80 – Accounting Principles
and Policies
89 – Notes to the Income
Statement
96 – Notes to the Balance Sheet
117 – Other Disclosures
131 – Segment Information
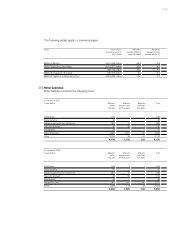
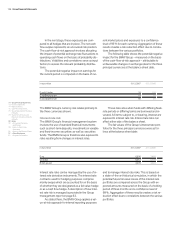
Gains/losses from the use of derivative instruments
relate primarily to fair value gains or losses arising on
stand-alone derivative instruments.
Write-downs of euro 49 million (2006: euro 2 mil-
lion)
on available-for-sale securities, for which fair
value changes were previously recognised directly
in equity, were recognised as expenses in 2007.
Reversals of write-downs on current marketable se-
curities of euro 2 million were recognised directly in
equity (2006: euro 4 million).
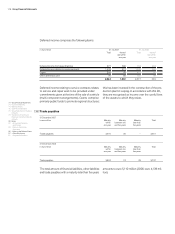
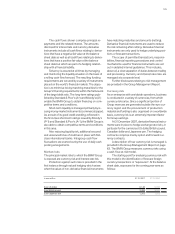
The disclosure of interest income resulting from
the unwinding of interest on future expected receipts
would normally only be relevant for the BMW Group
where assets have been discounted as part of the
process of determining impairment losses. However,
as a result of the assumption that most of the income
that is subsequently recovered is received within one
year and the fact that the impact is not material, the
BMW Group does not discount assets for the purposes
of determining impairment losses.
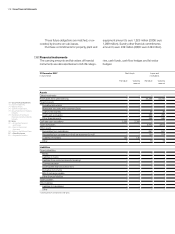
These interest rates were adjusted, where necessary, to take account of the credit quality and risk of the
underlying financial instrument.
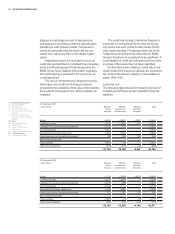
Fair value measurement of financial instruments
The fair values shown are computed using market
information available at the balance sheet date, on
the basis of prices quoted by the counterparties
or using appropriate measurement methods, e.g.
discounted cash flow models. In the latter case,
amounts were discounted at 31 December 2007
on the basis of the following interest rates:
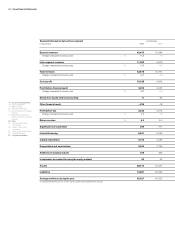
Gains and losses on financial instruments
The following table shows the net gains and losses arising for each of the categories of financial instrument
defined by IAS 39:
ISO-Code EUR USD GBP JPY
in %
Interest rate for six months 4.3 4.6 5.9 1.0
Interest rate for one year 4.3 4.2 5.7 1.1
Interest rate for five years 4.6 4.2 5.1 1.2
Interest rate for ten years 4.8 4.8 5.1 1.7
in euro million 2007 2006
Held for trading
Gains/losses from the use of derivative instruments – 39 17
Available-for-sale
Gains/losses on sale and fair value gains/losses on available-for-sale securities;
including equity investments carried at cost 49 44
Income from investments 3 62
Accumulated other equity
Balance at 1 January 214 562
Total change during the year – 179 – 348
– of which recognised in the income statement during the period under report – 168 – 431
Balance at 31 December 35 214
Loans and receivables
Impairment losses/reversals of impairment losses – 277 – 190
Other income/expenses – 12 – 31
Other liabilities
Income/expenses 168 108