BMW 2007 Annual Report Download - page 152
Download and view the complete annual report
Please find page 152 of the 2007 BMW annual report below. You can navigate through the pages in the report by either clicking on the pages listed below, or by using the keyword search tool below to find specific information within the annual report.-
 1
1 -
2
-
3
-
4
-
5
-
6
-
7
-
8
-
9
-
10
-
11
-
12
-
13
-
14
-
15
-
16
-
17
-
18
-
19
-
20
-
21
-
22
-
23
-
24
-
25
-
26
-
27
-
28
-
29
-
30
-
31
-
32
-
33
-
34
-
35
-
36
-
37
-
38
-
39
-
40
-
41
-
42
-
43
-
44
-
45
-
46
-
47
-
48
-
49
-
50
-
51
-
52
-
53
-
54
-
55
-
56
-
57
-
58
-
59
-
60
-
61
-
62
-
63
-
64
-
65
-
66
-
67
-
68
-
69
-
70
-
71
-
72
-
73
-
74
-
75
-
76
-
77
-
78
-
79
-
80
-
81
-
82
-
83
-
84
-
85
-
86
-
87
-
88
-
89
-
90
-
91
-
92
-
93
-
94
-
95
-
96
-
97
-
98
-
99
-
100
-
101
-
102
-
103
-
104
-
105
-
106
-
107
-
108
-
109
-
110
-
111
-
112
-
113
-
114
-
115
-
116
-
117
-
118
-
119
-
120
-
121
-
122
-
123
-
124
-
125
-
126
-
127
-
128
-
129
-
130
-
131
-
132
-
133
-
134
-
135
-
136
-
137
-
138
-
139
-
140
-
141
-
 142
142 -
 143
143 -
 144
144 -
 145
145 -
 146
146 -
 147
147 -
 148
148 -
 149
149 -
 150
150 -
 151
151 -
 152
152 -
 153
153 -
 154
154 -
 155
155 -
 156
156 -
 157
157 -
 158
158 -
 159
159 -
 160
160 -
 161
161 -
 162
162 -
163
-
164
-
165
-
166
-
167
-
168
-
169
-
170
-
171
-
172
-
173
-
174
-
175
-
176
-
177
-
178
-
179
-
180
-
181
-
182
-
183
-
184
-
185
-
186
-
187
-
188
-
189
-
190
-
191
-
192
-
193
-
194
-
195
-
196
-
197
-
198
-
199
-
200
-
201
-
202
-
203
-
204
-
205
-
206
-
207
-
208
-
209
-
210
-
211
-
212
-
213
-
214
-
215
-
216
-
217
-
218
-
219
-
220
-
221
-
222
-
223
-
224
-
225
-
226
-
227
-
228
-
229
-
230
-
231
-
232
-
233
-
234
-
235
-
236
-
237
-
238
-
239
-
240
-
241
-
242
-
243
-
244
-
245
-
246
-
247
 |
 |

150
148 Other Information
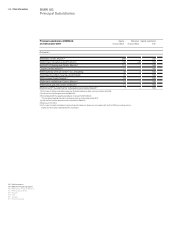
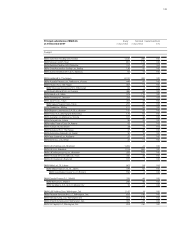
148 BMW AG Principal Subsidiaries
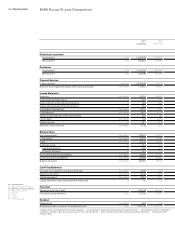
150 BMW Group 10-year Comparison
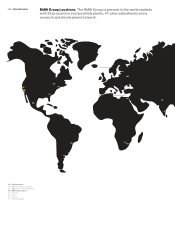
152 BMW Group Locations
154 Glossary
158 Index
160 Contacts
161 Financial Calendar
BMW Group 10-year Comparison
Other Information
2007 2006
IASs/IFRSs IASs/IFRSs
Deliveries to customers
Automobiles3] units 1,500,678 1,373,970
Motorcycles4] units 102,467 100,064
Production
Automobiles3] units 1,541,503 1,366,838
Motorcycles5] units 104,396 103,759
Financial Services
Contract portfolio contracts 2,629,949 2,270,528
Business volume (based on balance sheet carrying amounts) euro million 51,257 44,010
Income Statement
Revenues euro million 56,018 48,999
Gross profit percentage Group % 21.8 23.1
Gross profit percentage Industrial Operations % 19.8 20.3
Gross profit percentage Financial Operations % 10.3 11.4
Profit before financial result euro million 4,212 4,050
Profit before tax euro million 3,873 4,124
Return on sales (earnings before tax/revenues) % 6.9 8.4
Income taxes euro million 739 1,250
Effective tax rate % 19.1 30.3
Net profit/ – loss for the year euro million 3,134 2,874
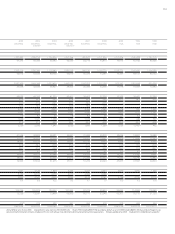
Balance Sheet
Non-current assets euro million 56,619 50,514
Current assets euro million 32,378 28,543
Equity euro million 21,744 19,130
Equity ratio Group % 24.4 24.2
Industrial Operations % 43.8 40.6
Financial Operations % 9.2 10.4
Non-current provisions and liabilities euro million 33,469 31,372
Current provisions and liabilities euro million 33,784 28,555
Balance sheet total euro million 88,997 79,057
Cash Flow Statement
Cash and cash equivalents at balance sheet date euro million 2,393 1,336
Operating cash flow 8] euro million 6,340 5,373
Capital expenditure euro million 4,267 4,313
Capital expenditure ratio (capital expenditure/revenues) % 7.6 8.8
Personnel
Workforce at the end of year7] 107,539 106,575
Personnel cost per employee euro 76,704 76,621
Dividend
Dividend total euro million 694 458
Dividend per share of common stock/preferred stock euro 1.06/1.08 0.70/0.72
1] adjusted for new accounting treatment of pension obligations 2
] reclassified after harmonisation of internal and external reporting systems 3
] including Rover Cars up to 9 May 2000
excluding C1 production by Bertone, production volume C1 up to 2002: 33,489 units 6
] the net profit before exceptional items amounted to euro 663 million 7
] figures since 1998
of treasury shares