BMW 2007 Annual Report Download - page 92
Download and view the complete annual report
Please find page 92 of the 2007 BMW annual report below. You can navigate through the pages in the report by either clicking on the pages listed below, or by using the keyword search tool below to find specific information within the annual report.-
 1
1 -
2
-
3
-
4
-
5
-
6
-
7
-
8
-
9
-
10
-
11
-
12
-
13
-
14
-
15
-
16
-
17
-
18
-
19
-
20
-
21
-
22
-
23
-
24
-
25
-
26
-
27
-
28
-
29
-
30
-
31
-
32
-
33
-
34
-
35
-
36
-
37
-
38
-
39
-
40
-
41
-
42
-
43
-
44
-
45
-
46
-
47
-
48
-
49
-
50
-
51
-
52
-
53
-
54
-
55
-
56
-
57
-
58
-
59
-
60
-
61
-
62
-
63
-
64
-
65
-
66
-
67
-
68
-
69
-
70
-
71
-
72
-
73
-
74
-
75
-
76
-
77
-
78
-
79
-
80
-
81
-
 82
82 -
 83
83 -
 84
84 -
 85
85 -
 86
86 -
 87
87 -
 88
88 -
 89
89 -
 90
90 -
 91
91 -
 92
92 -
 93
93 -
 94
94 -
 95
95 -
 96
96 -
 97
97 -
 98
98 -
 99
99 -
 100
100 -
 101
101 -
 102
102 -
103
-
104
-
105
-
106
-
107
-
108
-
109
-
110
-
111
-
112
-
113
-
114
-
115
-
116
-
117
-
118
-
119
-
120
-
121
-
122
-
123
-
124
-
125
-
126
-
127
-
128
-
129
-
130
-
131
-
132
-
133
-
134
-
135
-
136
-
137
-
138
-
139
-
140
-
141
-
142
-
143
-
144
-
145
-
146
-
147
-
148
-
149
-
150
-
151
-
152
-
153
-
154
-
155
-
156
-
157
-
158
-
159
-
160
-
161
-
162
-
163
-
164
-
165
-
166
-
167
-
168
-
169
-
170
-
171
-
172
-
173
-
174
-
175
-
176
-
177
-
178
-
179
-
180
-
181
-
182
-
183
-
184
-
185
-
186
-
187
-
188
-
189
-
190
-
191
-
192
-
193
-
194
-
195
-
196
-
197
-
198
-
199
-
200
-
201
-
202
-
203
-
204
-
205
-
206
-
207
-
208
-
209
-
210
-
211
-
212
-
213
-
214
-
215
-
216
-
217
-
218
-
219
-
220
-
221
-
222
-
223
-
224
-
225
-
226
-
227
-
228
-
229
-
230
-
231
-
232
-
233
-
234
-
235
-
236
-
237
-
238
-
239
-
240
-
241
-
242
-
243
-
244
-
245
-
246
-
247
 |
 |

90 Group Financial Statements
73 Group Financial Statements
73 Income Statements
74 Balance Sheets
76 Cash Flow Statements
78 Group Statement of Changes
in Equity
79 Statement of Income and
Expenses recognised directly
in Equity
80 Notes
80 – Accounting Principles
and Policies
89 – Notes to the Income
Statement
96 – Notes to the Balance Sheet
117 – Other Disclosures
131 – Segment Information
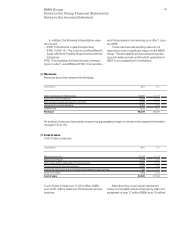
Cost of sales is reduced by public-sector subsidies
in the form of reduced taxes on assets and re-
duced consumption-based taxes amounting to euro
16 million (2006: euro 11 million).
Sales and administrative costs
Sales costs amounted to euro 4,284 million (2006:
euro 4,039 million) and comprise mainly marketing,
advertising and sales personnel costs.
Administrative costs amounted to euro 970 mil-
lion (2006: euro 933 million) and comprised ex-
penses for administration not attributable to develop-
ment, production or sales functions.
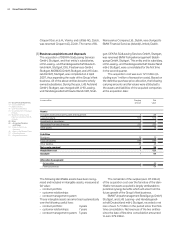
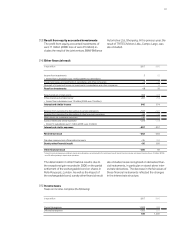
Research and development costs
Research and development costs of euro 2,920 mil-
lion (2006: euro 2,544 million) comprise all research
costs and development costs not recognised as
assets as well as amortisation of capitalised develop-
ment costs of euro 1,109 million (2006: euro 872
million).
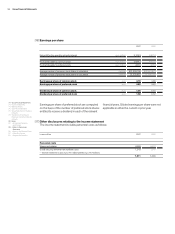
Total research and development expenditures
comprising research costs, development costs not
recognised as assets and capitalised development
costs were as follows:
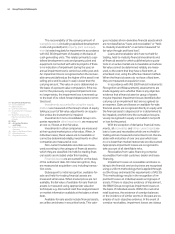
Other operating income and expenses
Sundry operating income includes public-sector grants of euro 36 million (2006: euro 32 million).
in euro million 2007 2006
Research and development costs 2,920 2,544
Amortisation – 1,109 – 872
New expenditure for capitalised development costs 1,333 1,536
Total research and development expenditures 3,144 3,208
in euro million 2007 2006
Exchange gains 204 245
Income from the reversal of provisions 90 141
Income from the reversal of write-downs 38 24
Gains on the disposal of assets 229 102
Sundry operating income 169 232
Other operating income 730 744
Exchange losses 231 219
Expense for additions to provisions 64 109
Expenses for impairment losses 25 34
Sundry operating expenses 210 155
Other operating expenses 530 517
Other operating income and expenses 200 227
[10]
[11]
[12]