Air New Zealand 2014 Annual Report Download - page 58
Download and view the complete annual report
Please find page 58 of the 2014 Air New Zealand annual report below. You can navigate through the pages in the report by either clicking on the pages listed below, or by using the keyword search tool below to find specific information within the annual report.-
 1
1 -
2
-
3
-
4
-
5
-
6
-
7
-
8
-
9
-
10
-
11
-
12
-
13
-
14
-
15
-
16
-
17
-
18
-
19
-
20
-
21
-
22
-
23
-
24
-
25
-
26
-
27
-
28
-
29
-
30
-
31
-
32
-
33
-
34
-
35
-
36
-
37
-
38
-
39
-
40
-
41
-
42
-
43
-
44
-
45
-
46
-
47
-
 48
48 -
 49
49 -
 50
50 -
 51
51 -
 52
52 -
 53
53 -
 54
54 -
 55
55 -
 56
56 -
 57
57 -
 58
58 -
 59
59 -
 60
60 -
 61
61 -
 62
62 -
 63
63 -
 64
64 -
 65
65 -
 66
66 -
 67
67 -
 68
68 -
69
-
70
-
71
-
72
-
73
-
74
-
75
-
76
-
77
-
78
-
79
-
80
 |
 |

AIR NEW ZEALAND ANNUAL FINANCIAL RESULTS 201456
2014
$M
2013
$M
2012
$M
2011
$M
2010
$M
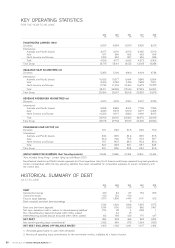
PASSENGERS CARRIED (000)
Domestic 8,920
8,694 8,500 8,530 8,018
International
Australia and Pacific Islands
Asia*
North America and Europe
3,277
517
1,005
3,181
596
940
3,073
652
897
2,965
662
946
2,700
668
938
Total 4,799 4,717 4,622 4,573 4,306
Total Group 13,719 13 , 411 13,122 13,103 12,324
AVAILABLE SEAT KILOMETRES (m)
Domestic
5,385 5,108 4,969 4,904 4,724
International
Australia and Pacific Islands
Asia*
North America and Europe
10,622
5,656
11,73 3
10,277
6,780
11, 0 02
9,694
7,495
10,460
9,345
7,432
10,672
8,804
7,557
10,493
Total 2 8 , 011 28,059 27,649 27,449 26,854
Total Group 33,396 33,167 32,618 32,353 31,578
REVENUE PASSENGER KILOMETRES (m)
Domestic 4,370 4,218 4,050 4,021 3,733
International
Australia and Pacific Islands
Asia*
North America and Europe
8,858
4,630
10,220
8,580
5,418
9,517
8,164
5,979
8,820
7,799
6,077
9,099
7,086
6,095
8,915
Total 23,708 23,515 22,963 22,975 22,096
Total Group 28,078 27,733 27,013 26,996 25,829
PASSENGER LOAD FACTOR (%)
Domestic 81.1 82.6 81.5 82.0 79.0
International
Australia and Pacific Islands
Asia*
North America and Europe
83.4
81.9
87.1
83.5
79.9
86.5
84.2
79.8
84.3
83.5
81.8
85.3
80.5
80.7
85.0
Total 84.7 83.8 83.1 83.7 82.3
Total Group 84.1 83.6 82.8 83.4 81.8
GROUP EMPLOYEE NUMBERS (Full Time Equivalents)
10,546 10,336 10,453
10,861
10,499
*Asia included Hong Kong - London flying up until March 2013.
New Zealand, Australia and Pacific Islands represent short haul operations. Asia, North America and Europe represent long haul operations.
Certain comparatives within the key operating statistics have been reclassified for comparative purposes, to ensure consistency with
the current year.
HISTORICAL SUMMARY OF DEBT
AS AT 30 JUNE
2014
$M
2013
$M
2012
$M
2011
$M
2010
$M
DEBT
Secured borrowings
Unsecured bonds
Finance lease liabilities
Bank overdraft and short term borrowings
213
150
1,370
-
84
150
1,395
-
97
150
1,445
2
154
-
1,101
-
263
-
812
-
Bank and short term deposits
Net open derivatives held in relation to interest-bearing liabilities1
Non interest-bearing deposit (included within Other assets)
Interest-bearing secured deposit (included within Other assets)
1,733
1,234
(10)
-
125
1,629
1,150
28
44
184
1,694
1,029
4
13
180
1,255
860
(28)
-
170
1,075
1,067
1
-
137
NET DEBT 384 223 468 253 (130)
Net aircraft operating lease commitments2 1,022 945 973 1,064 1,533
NET DEBT (INCLUDING OFF BALANCE SHEET) 1,406 1,168 1,441 1,317 1,403
1. Unrealised gains/losses on open debt derivatives.
2. Net aircraft operating lease commitments for the next twelve months, multiplied by a factor of seven.
KEY OPERATING STATISTICS
FOR THE YEAR TO 30 JUNE