Air New Zealand 2014 Annual Report Download - page 56
Download and view the complete annual report
Please find page 56 of the 2014 Air New Zealand annual report below. You can navigate through the pages in the report by either clicking on the pages listed below, or by using the keyword search tool below to find specific information within the annual report.-
 1
1 -
2
-
3
-
4
-
5
-
6
-
7
-
8
-
9
-
10
-
11
-
12
-
13
-
14
-
15
-
16
-
17
-
18
-
19
-
20
-
21
-
22
-
23
-
24
-
25
-
26
-
27
-
28
-
29
-
30
-
31
-
32
-
33
-
34
-
35
-
36
-
37
-
38
-
39
-
40
-
41
-
42
-
43
-
44
-
45
-
 46
46 -
 47
47 -
 48
48 -
 49
49 -
 50
50 -
 51
51 -
 52
52 -
 53
53 -
 54
54 -
 55
55 -
 56
56 -
 57
57 -
 58
58 -
 59
59 -
 60
60 -
 61
61 -
 62
62 -
 63
63 -
 64
64 -
 65
65 -
 66
66 -
67
-
68
-
69
-
70
-
71
-
72
-
73
-
74
-
75
-
76
-
77
-
78
-
79
-
80
 |
 |

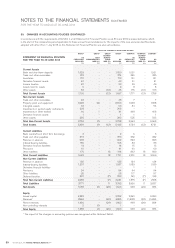
AIR NEW ZEALAND ANNUAL FINANCIAL RESULTS 201454
2014
$M
2013
$M
2012
$M
2011
$M
2010
$M
Current Assets
Bank and short term deposits
Other current assets
1,234
593
1,150
693
1,029
658
860
615
1,067
621
Total Current Assets 1,827 1,843 1,687 1,475 1,688
Non-Current Assets
Property, plant and equipment
Other non-current assets
2,994
1,029
2,933
820
3,090
668
2,714
713
2,230
679
Total Non-Current Assets 4,023 3,753 3,758 3,427 2,909
Total Assets 5,850 5,596 5,445 4,902 4,597
Current Liabilities
Net debt1
Other current liabilities
190
1,682
159
1,555
157
1,544
152
1,664
175
1,432
Total Current Liabilities 1,872 1,714 1,701 1,816 1,607
Non-Current Liabilities
Net debt1
Other non-current liabilities
1,543
563
1,470
611
1,537
544
1,103
479
900
524
Total Non-Current Liabilities 2,106 2,081 2,081 1,582 1,424
Total Liabilities 3,978 3,795 3,782 3,398 3,031
Net Assets 1,872 1,801 1,663 1,504 1,566
Total Equity 1,872 1,801 1,663 1,504 1,566
1. Net debt is comprised of bank overdraft, borrowings, bonds and finance lease liabilities.
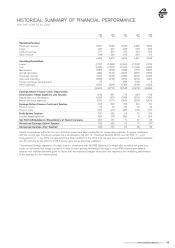
Certain comparatives within the five year statistical review have been reclassified for comparative purposes, to ensure consistency
with the current year. The Group adopted the amendments to NZ IAS 19 - Employee Benefits (2011) and NZ IFRS 11 - Joint
Arrangements on 1 July 2013. Comparatives in the Statement of Financial Position have been restated for the 2012 and 2013
financial year in respect of the adopted standards and the amounts for the 2010 and 2011 financial years are as previously published.
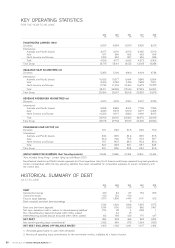
HISTORICAL SUMMARY OF CASH FLOWS
FOR THE YEAR TO 30 JUNE
2014
$M
2013
$M
2012
$M
2011
$M
2010
$M
Cash flow from operating activities
Cash flow from investing activities
Cash flow from financing activities
730
(727)
81
750
(480)
(147)
472
(654)
349
466
(846)
173
334
(450)
(390)
Increase/(decrease) in cash holding 84 123 167 (207) (506)
Total cash and cash equivalents 1,234 1,150 1,027 860 1,067
HISTORICAL SUMMARY OF FINANCIAL POSITION
AS AT 30 JUNE