Air New Zealand 2014 Annual Report Download - page 52
Download and view the complete annual report
Please find page 52 of the 2014 Air New Zealand annual report below. You can navigate through the pages in the report by either clicking on the pages listed below, or by using the keyword search tool below to find specific information within the annual report.-
 1
1 -
2
-
3
-
4
-
5
-
6
-
7
-
8
-
9
-
10
-
11
-
12
-
13
-
14
-
15
-
16
-
17
-
18
-
19
-
20
-
21
-
22
-
23
-
24
-
25
-
26
-
27
-
28
-
29
-
30
-
31
-
32
-
33
-
34
-
35
-
36
-
37
-
38
-
39
-
40
-
41
-
 42
42 -
 43
43 -
 44
44 -
 45
45 -
 46
46 -
 47
47 -
 48
48 -
 49
49 -
 50
50 -
 51
51 -
 52
52 -
 53
53 -
 54
54 -
 55
55 -
 56
56 -
 57
57 -
 58
58 -
 59
59 -
 60
60 -
 61
61 -
 62
62 -
63
-
64
-
65
-
66
-
67
-
68
-
69
-
70
-
71
-
72
-
73
-
74
-
75
-
76
-
77
-
78
-
79
-
80
 |
 |

AIR NEW ZEALAND ANNUAL FINANCIAL RESULTS 201450
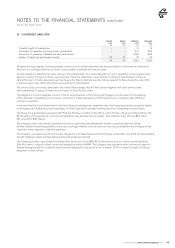
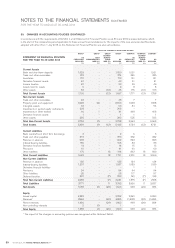
30. CHANGES IN ACCOUNTING POLICIES (CONTINUED)
In accordance with the requirements of NZ IAS 1, a full Statement of Financial Position as at 30 June 2012 is presented below, which
is the start of the comparative period applicable to these annual financial statements. The impacts of the new and amended Standards
adopted with effect from 1 July 2013 on this Statement of Financial Position are also set out below.
IMPACT OF CHANGES IN ACCOUNTING POLICIES
STATEMENT OF FINANCIAL POSITION
FOR THE YEAR TO 30 JUNE 2012
GROUP
AS
PREVIOUSLY
REPORTED
$M
GROUP
JOINT
ARRANGEMENTS
(SEE (C))
$M
GROUP
DEFINED
BENEFIT
PLANS
(SEE (F))
$M
GROUP
AS
RESTATED
$M
COMPANY
AS
PREVIOUSLY
REPORTED
$M
COMPANY
DEFINED
BENEFIT
PLANS
(SEE (F))
$M
COMPANY
AS
RESTATED
$M
Current Assets
Bank and short term deposits
Trade and other receivables
Inventories
Derivative financial assets
Income taxation
Assets held for resale
Other assets
1,029
374
170
40
20
9
58
-
-
-
-
-
-
-
-
-
-
-
-
-
(13)
1,029
374
170
40
20
9
45
1,021
335
141
41
49
8
176
-
-
-
-
-
-
(13)
1,021
335
141
41
49
8
163
Total Current Assets 1,700 -(13) 1,687 1,771 (13) 1,758
Non-Current Assets
Trade and other receivables
Property, plant and equipment
Intangible assets
Investments in quoted equity instruments
Investments in other entities
Derivative financial assets
Other assets
48
3,092
63
203
60
1
292
-
(2)
-
-
1
-
-
-
-
-
-
-
-
-
48
3,090
63
203
61
1
292
7
1,968
54
-
408
1
525
-
-
-
-
-
-
-
7
1,968
54
-
408
1
525
Total Non-Current Assets 3,759 (1) -3,758 2,963 -2,963
Total Assets 5,459 (1) (13) 5,445 4,734 (13) 4,721
Current Liabilities
Bank overdraft and short term borrowings
Trade and other payables
Revenue in advance
Interest-bearing liabilities
Derivative financial liabilities
Provisions
Other liabilities
2
373
902
155
14
61
176
-
-
-
-
-
-
-
-
-
-
-
-
-
18
2
373
902
155
14
61
194
6
332
893
83
15
60
862
-
-
-
-
-
-
18
6
332
893
83
15
60
880
Total Current Liabilities 1,683 -18 1,701 2,251 18 2,269
Non-Current Liabilities
Revenue in advance
Interest-bearing liabilities
Derivative financial liabilities
Provisions
Other liabilities
Deferred taxation
135
1,537
-
94
25
297
-
-
-
-
-
-
-
-
-
-
-
(7)
135
1,537
-
94
25
290
134
1,039
1
94
117
190
-
-
-
-
-
(7)
134
1,039
1
94
117
183
Total Non-Current Liabilities 2,088 -(7) 2,081 1,575 (7) 1,568
Total Liabilities 3,771 -11 3,782 3,826 11 3,837
Net Assets 1,688 (1) (24) 1,663 908 (24) 884
Equity
Issued capital
Reserves*
2,282
(596)
-
-
-
(24)
2,282
(620)
2,290
(1,382)
-
(24)
2,290
(1,406)
Parent interests
Non-controlling interests
1,686
2
-
(1)
(24)
-
1,662
1
908
-
(24)
-
884
-
Total Equity 1,688 (1) (24) 1,663 908 (24) 884
* The impact of the changes in accounting policies was recognised within Retained Deficit.
NOTES TO THE FINANCIAL STATEMENTS (CONTINUED)
FOR THE YEAR TO AND AS AT 30 JUNE 2014