Air New Zealand 2014 Annual Report Download - page 33
Download and view the complete annual report
Please find page 33 of the 2014 Air New Zealand annual report below. You can navigate through the pages in the report by either clicking on the pages listed below, or by using the keyword search tool below to find specific information within the annual report.-
 1
1 -
2
-
3
-
4
-
5
-
6
-
7
-
8
-
9
-
10
-
11
-
12
-
13
-
14
-
15
-
16
-
17
-
18
-
19
-
20
-
21
-
22
-
 23
23 -
 24
24 -
 25
25 -
 26
26 -
 27
27 -
 28
28 -
 29
29 -
 30
30 -
 31
31 -
 32
32 -
 33
33 -
 34
34 -
 35
35 -
 36
36 -
 37
37 -
 38
38 -
 39
39 -
 40
40 -
 41
41 -
 42
42 -
 43
43 -
44
-
45
-
46
-
47
-
48
-
49
-
50
-
51
-
52
-
53
-
54
-
55
-
56
-
57
-
58
-
59
-
60
-
61
-
62
-
63
-
64
-
65
-
66
-
67
-
68
-
69
-
70
-
71
-
72
-
73
-
74
-
75
-
76
-
77
-
78
-
79
-
80
 |
 |

AIR NEW ZEALAND ANNUAL FINANCIAL RESULTS 2014 31
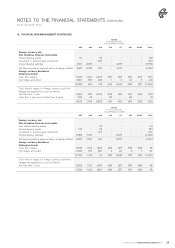
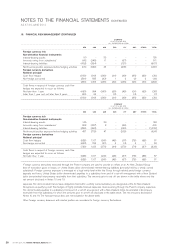
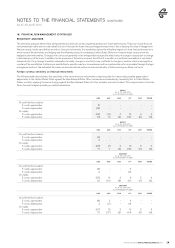
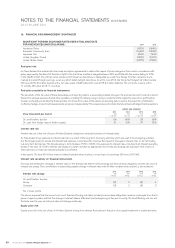
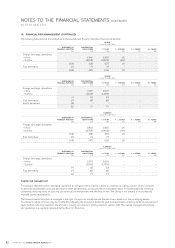
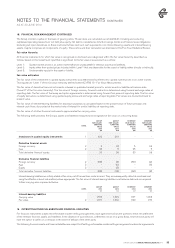
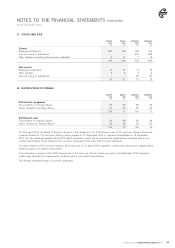
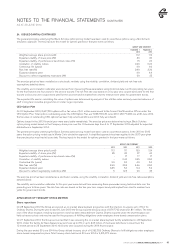
18. FINANCIAL RISK MANAGEMENT (CONTINUED)
Air New Zealand had exposure to equity price risk arising on the equity investment. As at 30 June 2013 the Group held an equity derivative in
Virgin Australia Holdings Limited. This investment is held for strategic rather than trading purposes. The Group does not hedge this risk.
Equity investment price risk sensitivity on financial instruments
The sensitivity to reasonably possible changes in the quoted price of an equity investment or derivative with all other variables held constant,
is set out below.
Equity investment price change:
2014
$M
+ 25%
2014
$M
- 25%
2013
$M
+ 25%
2013
$M
- 25%
On profit before taxation
Group
On investment revaluation reserve (within equity)
Group
-
105
-
(105)
11
65
(11)
(65)
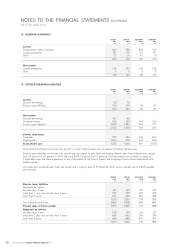
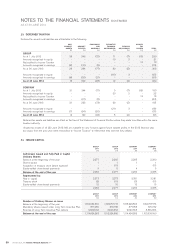
Liquidity risk
Liquidity risk is the risk that the Group will be unable to meet its obligations as they fall due. Air New Zealand manages the risk by targeting
a minimum liquidity level, ensuring long term commitments are managed with respect to forecast available cash inflow and managing maturity
profiles. Air New Zealand holds significant cash reserves to enable it to meet its liabilities as they fall due and to sustain operations in the event
of unanticipated external factors or events.
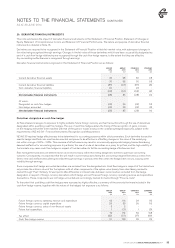
The following table sets out the contractual, undiscounted cash flows for non-derivative financial liabilities:
GROUP
AS AT 30 JUNE 2014
STATEMENT OF
FINANCIAL POSITION
$M
CONTRACTUAL
CASH FLOWS
$M
< 1 YEAR
$M
1 - 2 YEARS
$M
2 - 5 YEARS
$M
5+ YEARS
$M
Trade and other payables
Secured borrowings
Unsecured bonds
Finance lease obligations
398
213
150
1,370
398
236
176
1,516
398
26
10
191
-
40
10
195
-
56
156
539
-
114
-
591
Total non-derivative liabilities 2,131 2,326 625 245 751 705
GROUP
AS AT 30 JUNE 2013
STATEMENT OF
FINANCIAL POSITION
$M
CONTRACTUAL
CASH FLOWS
$M
< 1 YEAR
$M
1 - 2 YEARS
$M
2 - 5 YEARS
$M
5+ YEARS
$M
Trade and other payables
Secured borrowings
Unsecured bonds
Finance lease obligations
382
84
150
1,395
382
88
186
1,553
382
16
10
169
-
17
10
188
-
51
166
554
-
4
-
642
Total non-derivative liabilities 2 , 011 2,209 577 215 771 646
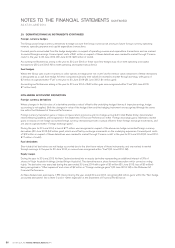
COMPANY
AS AT 30 JUNE 2014
STATEMENT OF
FINANCIAL POSITION
$M
CONTRACTUAL
CASH FLOWS
$M
< 1 YEAR
$M
1 - 2 YEARS
$M
2 - 5 YEARS
$M
5+ YEARS
$M
Trade and other payables
Unsecured bonds
Finance lease obligations
Amounts owing to subsidiaries
366
150
717
417
366
176
799
417
366
10
103
362
-
10
105
-
-
156
270
-
-
-
321
55
Total non-derivative liabilities 1,650 1,758 841 115 426 376
COMPANY
AS AT 30 JUNE 2013
STATEMENT OF
FINANCIAL POSITION
$M
CONTRACTUAL
CASH FLOWS
$M
< 1 YEAR
$M
1 - 2 YEARS
$M
2 - 5 YEARS
$M
5+ YEARS
$M
Bank overdraft and short-term
borrowings
Trade and other payables
Unsecured bonds
Finance lease obligations
Amounts owing to subsidiaries
1
347
150
858
539
1
347
186
956
539
1
347
10
105
483
-
-
10
107
-
-
-
166
318
-
-
-
-
426
56
Total non-derivative liabilities 1,895 2,029 946 117 484 482
NOTES TO THE FINANCIAL STATEMENTS (CONTINUED)
AS AT 30 JUNE 2014