Air New Zealand 2014 Annual Report Download - page 55
Download and view the complete annual report
Please find page 55 of the 2014 Air New Zealand annual report below. You can navigate through the pages in the report by either clicking on the pages listed below, or by using the keyword search tool below to find specific information within the annual report.-
 1
1 -
2
-
3
-
4
-
5
-
6
-
7
-
8
-
9
-
10
-
11
-
12
-
13
-
14
-
15
-
16
-
17
-
18
-
19
-
20
-
21
-
22
-
23
-
24
-
25
-
26
-
27
-
28
-
29
-
30
-
31
-
32
-
33
-
34
-
35
-
36
-
37
-
38
-
39
-
40
-
41
-
42
-
43
-
44
-
 45
45 -
 46
46 -
 47
47 -
 48
48 -
 49
49 -
 50
50 -
 51
51 -
 52
52 -
 53
53 -
 54
54 -
 55
55 -
 56
56 -
 57
57 -
 58
58 -
 59
59 -
 60
60 -
 61
61 -
 62
62 -
 63
63 -
 64
64 -
 65
65 -
66
-
67
-
68
-
69
-
70
-
71
-
72
-
73
-
74
-
75
-
76
-
77
-
78
-
79
-
80
 |
 |

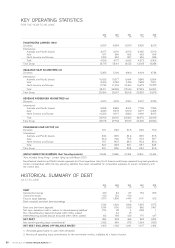
AIR NEW ZEALAND ANNUAL FINANCIAL RESULTS 2014 53
2014
$M
2013
$M
2012
$M
2011
$M
2010
$M
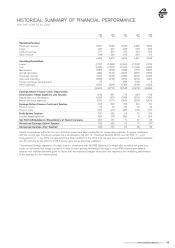
Operating Revenue
Passenger revenue
Cargo
Contract services
Other revenue
3,851
287
277
248
3,765
301
310
239
3,634
298
316
235
3,525
278
329
209
3,305
255
322
164
Operating Expenditure
Labour
Fuel
Maintenance
Aircraft operations
Passenger services
Sales and marketing
Foreign exchange gains/(losses)
Other expenses
4,663
(1,151)
(1,121)
(285)
(424)
(212)
(280)
45
(222)
4,615
(1,068)
(1,204)
(302)
(419)
(222)
(274)
7
(236)
4,483
(1,050)
(1,219)
(303)
(390)
(233)
(270)
(68)
(235)
4,341
(1,034)
(1,084)
(311)
(381)
(242)
(274)
(118)
(234)
4,046
(976)
(939)
(326)
(369)
(240)
(261)
6
(233)
(3,650) (3,718) (3,768) (3,678) (3,338)
Earnings Before Finance Costs, Depreciation,
Amortisation, Rental Expenses and Taxation
Depreciation and amortisation
Rental and lease expenses
1,013
(436)
(174)
897
(411)
(177)
715
(348)
(209)
663
(316)
(238)
708
(294)
(263)
Earnings Before Finance Costs and Taxation
Finance income
Finance costs
403
44
(90)
309
37
(91)
158
31
(95)
109
36
(72)
151
43
(71)
Profit Before Taxation
Taxation (expense)/credit
357
(95)
255
(74)
94
(23)
73
8
123
(41)
Net Profit Attributable to Shareholders of Parent Company 262 181 71 81 82
Normalised Earnings Before Taxation* 332 255 91 75 137
Normalised Earnings After Taxation* 244 181 69 82 92
Certain comparatives within the five year statistical review have been reclassified for comparative purposes, to ensure consistency
with the current year. The Group adopted the amendments to NZ IAS 19 - Employee Benefits (2011) and NZ IFRS 11 - Joint
Arrangements on 1 July 2013. Comparatives have been restated for the 2013 financial year only in respect of the adopted standards
and the amounts for the 2010 to 2012 financial years are as previously published.
* Normalised Earnings represents Earnings stated in compliance with NZ IFRS (Statutory Earnings) after excluding net gains and
losses on derivatives that hedge exposures in other financial periods. Normalised Earnings is a non-IFRS financial performance
measure that matches derivative gains or losses with the underlying hedged transaction, and represents the underlying performance
of the business for the relevant period.
HISTORICAL SUMMARY OF FINANCIAL PERFORMANCE
FOR THE YEAR TO 30 JUNE