Air New Zealand 2014 Annual Report Download - page 57
Download and view the complete annual report
Please find page 57 of the 2014 Air New Zealand annual report below. You can navigate through the pages in the report by either clicking on the pages listed below, or by using the keyword search tool below to find specific information within the annual report.-
 1
1 -
2
-
3
-
4
-
5
-
6
-
7
-
8
-
9
-
10
-
11
-
12
-
13
-
14
-
15
-
16
-
17
-
18
-
19
-
20
-
21
-
22
-
23
-
24
-
25
-
26
-
27
-
28
-
29
-
30
-
31
-
32
-
33
-
34
-
35
-
36
-
37
-
38
-
39
-
40
-
41
-
42
-
43
-
44
-
45
-
46
-
 47
47 -
 48
48 -
 49
49 -
 50
50 -
 51
51 -
 52
52 -
 53
53 -
 54
54 -
 55
55 -
 56
56 -
 57
57 -
 58
58 -
 59
59 -
 60
60 -
 61
61 -
 62
62 -
 63
63 -
 64
64 -
 65
65 -
 66
66 -
 67
67 -
68
-
69
-
70
-
71
-
72
-
73
-
74
-
75
-
76
-
77
-
78
-
79
-
80
 |
 |

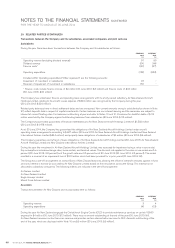
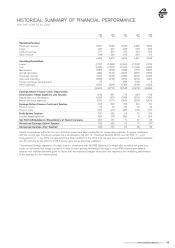
AIR NEW ZEALAND ANNUAL FINANCIAL RESULTS 2014 55
2014
$M
2013
$M
2012
$M
2011
$M
2010
$M
PROFITABILITY
EBIT/Revenue
EBITDRA/Revenue
Return on Assets1
Return on Equity2
Basic Earnings Per Ordinary Share
Fixed Cover3
Passenger Revenue/RPK
%
%
%
%
cps
times
cents
8.6
21.7
6.9
14.0
23.8
4.6
13.7
6.7
19.4
5.5
10.0
16.5
3.9
13.6
3.5
15.9
2.9
4.2
6.5
2.6
13.5
2.5
15.3
2.2
5.4
7.5
2.4
13.1
3.7
17.5
3.3
5.2
7.6
2.4
12.8
LIQUIDITY
Operating Cash Flow Per Share4cps
66.3 68.4
43.1 43.0 31.1
BALANCE SHEET
Gearing (excl. net capitalised aircraft operating leases)5
Gearing (incl. net capitalised aircraft operating leases)6
Debt to Equity Ratio7
Net Tangible Assets Per Share4
Working Capital Ratio8
%
%
%
$
%
17.0
42.9
212.5
1.61
49.4
11. 0
39.3
210.7
1.57
51.8
21.7
46.1
223.4
1.48
50.3
14.4
46.7
225.9
1.33
44.8
(9.1)
47.3
193.6
1.41
51.2
SHAREHOLDER VALUE
Closing Share Price 30 June
Weighted Average Number of Ordinary Shares
Total Number of Ordinary Shares
Total Market Capitalisation
Total Shareholder Return
$
m
m
$m
%
2.08
1,101
1,114
2,318
40.1
1.49
1,096
1,104
1,639
72.7
0.86
1,096
1,100
946
(23.2)
1.12
1,084
1,091
1,222
4.7
1.07
1,073
1,077
1,152
18.9
1. EBIT/Total Assets
2. Net Profit After Tax/Total Equity
3. EBITDRA/(Rental and Lease Expenses and Net Finance Costs)
4. Per-share measures based upon Ordinary Shares
5. Net Debt (excluding capitalised operating leases)/Net Debt plus Equity
6. Net Debt (including capitalised operating leases)/Net Debt plus Equity
7. Total Liabilities/Total Equity
8. Current Assets/(Current Assets plus Current Liabilities)
Certain comparatives within the five year statistical review have been reclassified for comparative purposes, to ensure consistency
with the current year. The Group adopted the amendments to NZ IAS 19 - Employee Benefits (2011) and NZ IFRS 11 - Joint
Arrangements on 1 July 2013. Comparatives have been restated for the 2013 financial year only in respect of the adopted standards
and the amounts for the 2010 to 2012 financial years are as previously published.
FINANCIAL RATIOS
FIVE YEAR STATISTICAL REVIEW