Air New Zealand 2014 Annual Report Download - page 22
Download and view the complete annual report
Please find page 22 of the 2014 Air New Zealand annual report below. You can navigate through the pages in the report by either clicking on the pages listed below, or by using the keyword search tool below to find specific information within the annual report.-
 1
1 -
2
-
3
-
4
-
5
-
6
-
7
-
8
-
9
-
10
-
11
-
 12
12 -
 13
13 -
 14
14 -
 15
15 -
 16
16 -
 17
17 -
 18
18 -
 19
19 -
 20
20 -
 21
21 -
 22
22 -
 23
23 -
 24
24 -
 25
25 -
 26
26 -
 27
27 -
 28
28 -
 29
29 -
 30
30 -
 31
31 -
 32
32 -
33
-
34
-
35
-
36
-
37
-
38
-
39
-
40
-
41
-
42
-
43
-
44
-
45
-
46
-
47
-
48
-
49
-
50
-
51
-
52
-
53
-
54
-
55
-
56
-
57
-
58
-
59
-
60
-
61
-
62
-
63
-
64
-
65
-
66
-
67
-
68
-
69
-
70
-
71
-
72
-
73
-
74
-
75
-
76
-
77
-
78
-
79
-
80
 |
 |

AIR NEW ZEALAND ANNUAL FINANCIAL RESULTS 201420
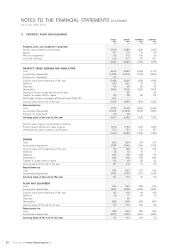
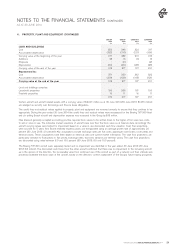
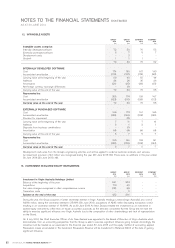
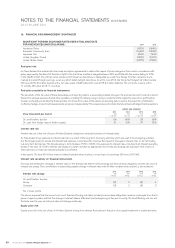
11. PROPERTY, PLANT AND EQUIPMENT
GROUP
2014
$M
GROUP
2013
$M
COMPANY
2014
$M
COMPANY
2013
$M
Property, plant and equipment comprises:
Aircraft, spare engines and simulators
Spares
Plant and equipment
Land and buildings
2,569
101
112
212
2,488
116
112
217
1,236
76
100
197
1,392
90
99
201
2,994 2,933 1,609 1,782
AIRCRAFT, SPARE ENGINES AND SIMULATORS
Cost
Accumulated depreciation
Provision for impairment
3,932
(1,439)
(5)
3,822
(1,216)
-
2,098
(706)
-
2,112
(569)
-
Carrying value at the beginning of the year
Additions
Disposals
Depreciation
Impairment losses recognised during the year
Transfer to assets held for resale
Net foreign currency exchange differences (refer Note 18)
2,488
440
(7)
(335)
-
(5)
(12)
2,606
220
(6)
(319)
(5)
(8)
-
1,392
19
(2)
(169)
-
(4)
-
1,543
51
(1)
(194)
(1)
(6)
-
Carrying value at the end of the year 2,569 2,488 1,236 1,392
Represented by:
Cost
Accumulated depreciation
Provision for impairment
4,272
(1,698)
(5)
3,932
(1,439)
(5)
2,062
(826)
-
2,098
(706)
-
Carrying value at the end of the year 2,569 2,488 1,236 1,392
Aircraft, spare engines and simulators comprise:
Finance leased aircraft and spare engines
Owned aircraft, spare engines and simulators
1,819
750
1,765
723
1,124
112
1,235
157
2,569 2,488 1,236 1,392
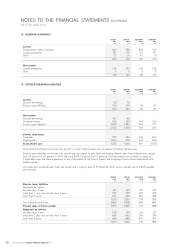
SPARES
Cost
Accumulated depreciation
263
(147)
264
(136)
214
(124)
219
(115 )
Carrying value at the beginning of the year
Additions
Disposals
Depreciation
Transfer to assets held for resale
116
24
(16)
(18)
(5)
128
13
(5)
(19)
(1)
90
19
(13)
(15)
(5)
104
7
(4)
(16)
(1)
Carrying value at the end of the year 101 116 76 90
Represented by:
Cost
Accumulated depreciation
236
(135)
263
(147)
187
(111)
214
(124)
Carrying value at the end of the year 101 116 76 90
PLANT AND EQUIPMENT
Cost
Accumulated depreciation
363
(251)
366
(242)
328
(229)
330
(222)
Carrying value at the beginning of the year
Additions
Disposals
Depreciation
112
28
-
(28)
124
17
(1)
(28)
99
26
-
(25)
108
16
-
(25)
Carrying value at the end of the year 112 112 100 99
Represented by:
Cost
Accumulated depreciation
382
(270)
363
(251)
347
(247)
328
(229)
Carrying value at the end of the year 112 112 100 99
NOTES TO THE FINANCIAL STATEMENTS (CONTINUED)
AS AT 30 JUNE 2014