Air New Zealand 2014 Annual Report Download - page 4
Download and view the complete annual report
Please find page 4 of the 2014 Air New Zealand annual report below. You can navigate through the pages in the report by either clicking on the pages listed below, or by using the keyword search tool below to find specific information within the annual report.-
 1
1 -
 2
2 -
 3
3 -
 4
4 -
 5
5 -
 6
6 -
 7
7 -
 8
8 -
 9
9 -
 10
10 -
 11
11 -
 12
12 -
 13
13 -
 14
14 -
 15
15 -
16
-
17
-
18
-
19
-
20
-
21
-
22
-
23
-
24
-
25
-
26
-
27
-
28
-
29
-
30
-
31
-
32
-
33
-
34
-
35
-
36
-
37
-
38
-
39
-
40
-
41
-
42
-
43
-
44
-
45
-
46
-
47
-
48
-
49
-
50
-
51
-
52
-
53
-
54
-
55
-
56
-
57
-
58
-
59
-
60
-
61
-
62
-
63
-
64
-
65
-
66
-
67
-
68
-
69
-
70
-
71
-
72
-
73
-
74
-
75
-
76
-
77
-
78
-
79
-
80
 |
 |

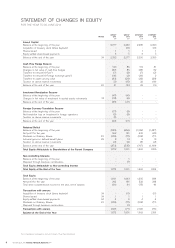
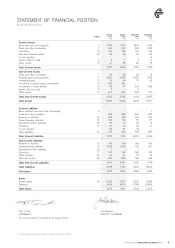
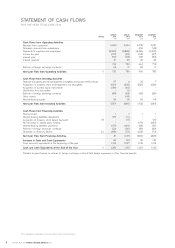
The accompanying accounting policies and notes form part of these financial statements.
AIR NEW ZEALAND ANNUAL FINANCIAL RESULTS 2014
2
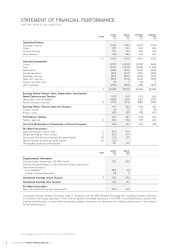
STATEMENT OF FINANCIAL PERFORMANCE
FOR THE YEAR TO 30 JUNE 2014
NOTES
GROUP
2014
$M
GROUP
2013
$M
COMPANY
2014
$M
COMPANY
2013
$M
Operating Revenue
Passenger revenue
Cargo
Contract services
Other revenue
3,851
287
277
248
3,765
301
310
239
3,237
281
223
460
3,193
296
242
490
Operating Expenditure
Labour
Fuel
Maintenance
Aircraft operations
Passenger services
Sales and marketing
Foreign exchange gains
Other expenses
1, 2 4,663
(1,151)
(1,121)
(285)
(424)
(212)
(280)
45
(222)
4,615
(1,068)
(1,204)
(302)
(419)
(222)
(274)
7
(236)
4,201
(1,002)
(1,026)
(206)
(321)
(203)
(264)
59
(62)
4,221
(915)
(1,109)
(225)
(326)
(214)
(257)
4
(213)
3 (3,650) (3,718) (3,025) (3,255)
Earnings Before Finance Costs, Depreciation, Amortisation,
Rental Expenses and Taxation
Depreciation and amortisation
Rental and lease expenses 3
1,013
(436)
(174)
897
(411)
(177)
1,176
(261)
(281)
966
(277)
(258)
Earnings Before Finance Costs and Taxation
Finance income
Finance costs
403
44
(90)
309
37
(91)
634
47
(73)
431
40
(81)
Profit Before Taxation
Taxation expense 4
357
(95)
255
(74)
608
(76)
390
(42)
Net Profit Attributable to Shareholders of Parent Company 262 181 532 348
Per Share Information:
Basic earnings per share (cents)
Diluted earnings per share (cents)
Interim and final dividends declared per share (cents)
Special dividend declared per share (cents)
Net tangible assets per share (cents)
5
5
22
22
23.8
23.6
10.0
10.0
161
16.5
16.4
8.0
-
157
NOTE
GROUP
2014
$M
GROUP
2013
$M
Supplementary Information
Earnings before Taxation (per NZ IFRS above)
Reverse net (gains)/losses on derivatives that hedge exposures in
other financial periods:
Fuel derivatives
Foreign exchange derivatives
357
(22)
(3)
255
(2)
2
Normalised Earnings before Taxation 3332 255
Normalised Earnings after Taxation 244 181
Per Share Information:
Basic normalised earnings per share (cents) 22.2 16.5
Normalised Earnings represents Earnings stated in compliance with NZ IFRS (Statutory Earnings) after excluding net gains and losses
on derivatives that hedge exposures in other financial periods. Normalised Earnings is a non-IFRS financial performance measure that
matches derivative gains or losses with the underlying hedged transaction, and represents the underlying performance of the business
for the relevant period.