Air New Zealand 2014 Annual Report Download - page 43
Download and view the complete annual report
Please find page 43 of the 2014 Air New Zealand annual report below. You can navigate through the pages in the report by either clicking on the pages listed below, or by using the keyword search tool below to find specific information within the annual report.-
 1
1 -
2
-
3
-
4
-
5
-
6
-
7
-
8
-
9
-
10
-
11
-
12
-
13
-
14
-
15
-
16
-
17
-
18
-
19
-
20
-
21
-
22
-
23
-
24
-
25
-
26
-
27
-
28
-
29
-
30
-
31
-
32
-
 33
33 -
 34
34 -
 35
35 -
 36
36 -
 37
37 -
 38
38 -
 39
39 -
 40
40 -
 41
41 -
 42
42 -
 43
43 -
 44
44 -
 45
45 -
 46
46 -
 47
47 -
 48
48 -
 49
49 -
 50
50 -
 51
51 -
 52
52 -
 53
53 -
54
-
55
-
56
-
57
-
58
-
59
-
60
-
61
-
62
-
63
-
64
-
65
-
66
-
67
-
68
-
69
-
70
-
71
-
72
-
73
-
74
-
75
-
76
-
77
-
78
-
79
-
80
 |
 |
AIR NEW ZEALAND ANNUAL FINANCIAL RESULTS 2014 41
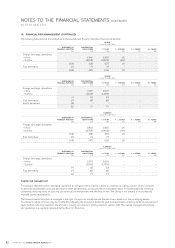
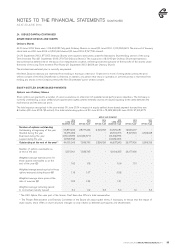
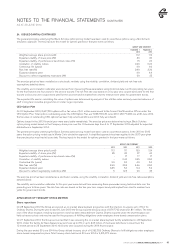
24. ISSUED CAPITAL (CONTINUED)
The general principles underlying the Black Scholes option pricing model have been used to value these options using a Monte Carlo
simulation approach. The key inputs to this model for options granted in that year were as follows:
GROUP AND COMPANY
TRANCHE 1
2013
TRANCHE 2
2013
Weighted average share price (cents)
Expected volatility of share price (%)
Expected volatility of performance benchmark index (%)
Correlation of volatility indices
Contractual life (years)
Risk free rate (%)
Expected dividend yield
Discount to reflect negotiability restrictions (%)
112
30
15
0.20
4.0
2.90
4.9
20
112
30
20
0.20
6.0
3.30
4.9
25
The exercise price has been modelled as a stochastic variable, using the volatility, correlation, dividend yield and risk free rate
assumptions detailed above.
The volatility and correlation estimates were derived from measuring these parameters using historical data over the preceding two years
for the first tranche and four years for the second tranche. The risk free rate was based on a four year zero coupon bond yield for the first
tranche and six year zero coupon bond yield for the second tranche implied from short to medium term yields for government bonds.
The expected life used in calculating the value of options was determined by analysis of the attrition rates and early exercise behaviour of
staff in long term incentive programmes in similar large corporates.
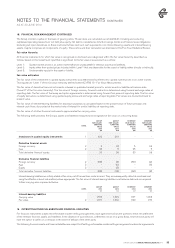
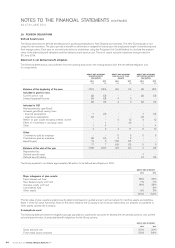
CEO Option Plan
On 21 September 2012, 8,607,519 options with a fair value of $1.1 million were issued to the former Chief Executive Officer under the
CEO Option Plan. Total options outstanding under the CEO Option Plan are 7,938,765 (30 June 2013: 28,177,436). As at 30 June 2014
the fair value of outstanding CEO options has been fully amortised (30 June 2013: fully amortised).
Options issued in the 2013 financial year were exercisable immediately. The exercise price was determined using a Black Scholes
option pricing model based on the Company share price over the 10 business days from 4 to 17 September 2012 adjusted for expected
distributions in September 2014.
The general principles underlying the Black Scholes option pricing model have been used to value these options. In the 2010 to 2012
years the option pricing model used a Monte Carlo simulation approach. A simplified approach has been applied in the 2013 year given
the exercise price was fixed at issue date. The key inputs to this model for options granted in that year were as follows:
GROUP AND COMPANY
2013 2012 2 011 2010
Weighted average share price (cents)
Expected volatility of share price (%)
Expected volatility of performance benchmark index (%)
Correlation of volatility indices
Contractual life (years)
Risk free rate (%)
Expected dividend yield
Discount to reflect negotiability restrictions (%)
112
25
-
-
2.0
2.60
3.35
5
111
30
17
0.40
3.0
3.54
5.0
12.5
129
37
17
0.45
4.0
4.46
5.4
20
124
40
17
0.50
5.0
5.50
5.2
25
The exercise price has been modelled as a stochastic variable, using the volatility, correlation, dividend yield and risk free rate assumptions
detailed above.
The volatility and correlation estimates for the prior year were derived from measuring these parameters using historical data over the
preceding one to three years. The risk free rate was based on the two year zero coupon bond yield implied from short to medium term
yields for government bonds.
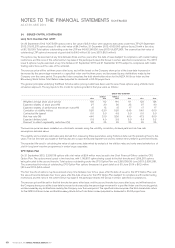
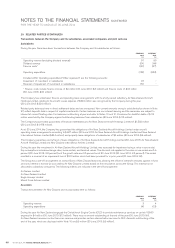
APPLICATION OF TREASURY STOCK METHOD
Share repurchase
On 28 September 2012 the Group announced an on-market share buyback programme with the intention to acquire up to 3% of its
Ordinary Shares. During the year ended 30 June 2013 the Group acquired treasury stock of 8,767,702 shares for $11 million. The total
cost of the share buyback including transaction costs has been deducted from Capital. Shares acquired under the share buyback are
held as treasury stock and may be used for the purposes of fulfilling obligations under employee share-based compensation plans.
On 27 September 2013, the Group announced that it was renewing the on-market share buyback facility established on 28 September
2012. Under the facility Air New Zealand may purchase up to 3% or up to $45 million of its shares (whichever is lower) over the
12 month period to 28 September 2014. No shares were acquired during the 2014 financial year.
During the year ended 30 June 2014 the Group utilised treasury stock of 6,252,332 Ordinary Shares to fulfil obligations under employee
share-based compensation plans. Total treasury stock held as at 30 June 2014 is 2,515,370 shares.
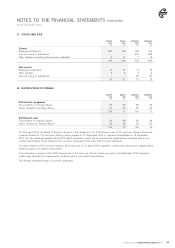
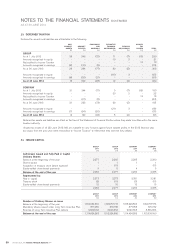
NOTES TO THE FINANCIAL STATEMENTS (CONTINUED)
AS AT 30 JUNE 2014