Air New Zealand 2014 Annual Report Download - page 31
Download and view the complete annual report
Please find page 31 of the 2014 Air New Zealand annual report below. You can navigate through the pages in the report by either clicking on the pages listed below, or by using the keyword search tool below to find specific information within the annual report.-
 1
1 -
2
-
3
-
4
-
5
-
6
-
7
-
8
-
9
-
10
-
11
-
12
-
13
-
14
-
15
-
16
-
17
-
18
-
19
-
20
-
 21
21 -
 22
22 -
 23
23 -
 24
24 -
 25
25 -
 26
26 -
 27
27 -
 28
28 -
 29
29 -
 30
30 -
 31
31 -
 32
32 -
 33
33 -
 34
34 -
 35
35 -
 36
36 -
 37
37 -
 38
38 -
 39
39 -
 40
40 -
 41
41 -
42
-
43
-
44
-
45
-
46
-
47
-
48
-
49
-
50
-
51
-
52
-
53
-
54
-
55
-
56
-
57
-
58
-
59
-
60
-
61
-
62
-
63
-
64
-
65
-
66
-
67
-
68
-
69
-
70
-
71
-
72
-
73
-
74
-
75
-
76
-
77
-
78
-
79
-
80
 |
 |

AIR NEW ZEALAND ANNUAL FINANCIAL RESULTS 2014 29
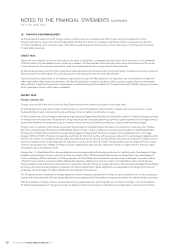
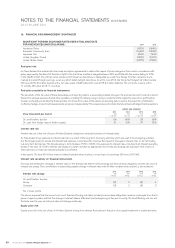
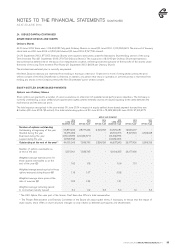
18. FINANCIAL RISK MANAGEMENT (CONTINUED)
SENSITIVITY ANALYSES
The sensitivity analyses which follow are hypothetical and should not be considered predictive of future performance. They only include financial
instruments (derivative and non-derivative) and do not include the future forecast hedged transactions or the underlying fair value of hedged non-
financial assets. As the sensitivities are only on financial instruments, the sensitivities ignore the offsetting impact on future forecast transactions
which many of the derivatives are hedging and the offsetting impact on underlying United States Dollar non-financial asset values, which are
hedged by debt instruments. Changes in fair value can generally not be extrapolated because the relationship of change in assumption to change
in fair value may not be linear. In addition, for the purposes of the below analyses, the effect of a variation in a particular assumption is calculated
independently of any change in another assumption. In reality, changes in one factor may contribute to changes in another, which may magnify or
counteract the sensitivities. Furthermore, sensitivities to specific events or circumstances will be counteracted as far as possible through strategic
management actions. The estimated fair values as disclosed should not be considered indicative of future earnings on these contracts.
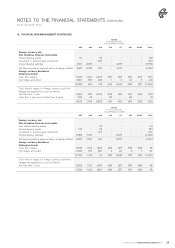
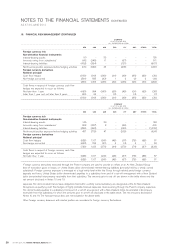
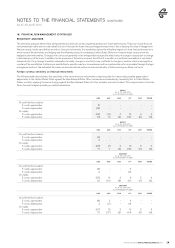
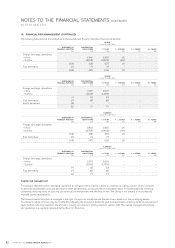
Foreign currency sensitivity on financial instruments
The following table demonstrates the sensitivity of the above financial instruments at reporting date to a reasonably possible appreciation/
depreciation in the United States Dollar against the New Zealand Dollar. Other currencies are evaluated by converting first to United States
Dollars and then applying the above change against the New Zealand Dollar. All other variables are held constant. This analysis does not include
future forecast hedged operating or capital transactions.
GROUP
AS AT 30 JUNE 2014
ALL EXPRESSED IN NZ$M
USD AUD EUR JPY GBP OTHER
On profit before taxation
5 cents appreciation
5 cents depreciation
On equity
5 cents appreciation
5 cents depreciation
15
(16)
(53)
59
-
-
(9)
10
-
-
4
(4)
-
-
14
(16)
-
-
6
(6)
-
-
4
(5)
GROUP
AS AT 30 JUNE 2013
ALL EXPRESSED IN NZ$M
USD AUD EUR JPY GBP OTHER
On profit before taxation
5 cents appreciation
5 cents depreciation
On equity
5 cents appreciation
5 cents depreciation
(5)
6
(63)
71
-
-
(1)
1
-
-
3
(3)
-
-
16
(18)
-
-
5
(5)
-
-
5
(6)
COMPANY
AS AT 30 JUNE 2014
ALL EXPRESSED IN NZ$M
USD AUD EUR JPY GBP OTHER
On profit before taxation
5 cents appreciation
5 cents depreciation
On equity
5 cents appreciation
5 cents depreciation
(3)
3
(55)
62
-
-
14
(16)
-
-
3
(3)
5
(5)
9
(11)
-
-
5
(5)
-
-
4
(5)
COMPANY
AS AT 30 JUNE 2013
ALL EXPRESSED IN NZ$M
USD AUD EUR JPY GBP OTHER
On profit before taxation
5 cents appreciation
5 cents depreciation
On equity
5 cents appreciation
5 cents depreciation
(3)
3
(67)
75
2
(2)
15
(17)
-
-
3
(3)
4
(4)
12
(14)
-
-
5
(5)
-
-
5
(6)
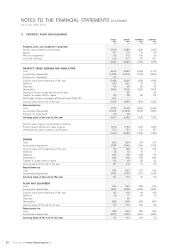
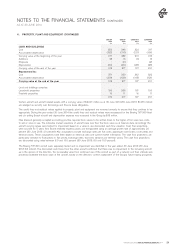
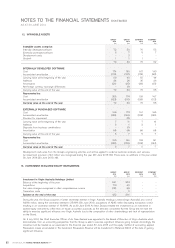
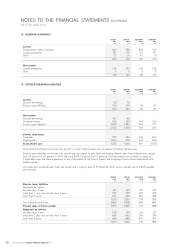
NOTES TO THE FINANCIAL STATEMENTS (CONTINUED)
AS AT 30 JUNE 2014