Air New Zealand 2014 Annual Report Download - page 51
Download and view the complete annual report
Please find page 51 of the 2014 Air New Zealand annual report below. You can navigate through the pages in the report by either clicking on the pages listed below, or by using the keyword search tool below to find specific information within the annual report.-
 1
1 -
2
-
3
-
4
-
5
-
6
-
7
-
8
-
9
-
10
-
11
-
12
-
13
-
14
-
15
-
16
-
17
-
18
-
19
-
20
-
21
-
22
-
23
-
24
-
25
-
26
-
27
-
28
-
29
-
30
-
31
-
32
-
33
-
34
-
35
-
36
-
37
-
38
-
39
-
40
-
 41
41 -
 42
42 -
 43
43 -
 44
44 -
 45
45 -
 46
46 -
 47
47 -
 48
48 -
 49
49 -
 50
50 -
 51
51 -
 52
52 -
 53
53 -
 54
54 -
 55
55 -
 56
56 -
 57
57 -
 58
58 -
 59
59 -
 60
60 -
 61
61 -
62
-
63
-
64
-
65
-
66
-
67
-
68
-
69
-
70
-
71
-
72
-
73
-
74
-
75
-
76
-
77
-
78
-
79
-
80
 |
 |

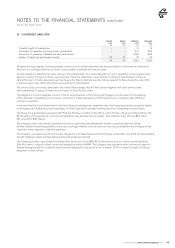
AIR NEW ZEALAND ANNUAL FINANCIAL RESULTS 2014 49
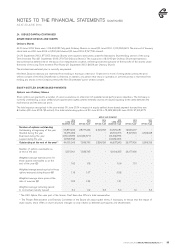
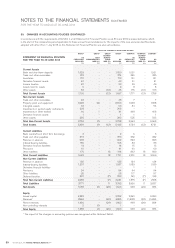
30. CHANGES IN ACCOUNTING POLICIES (CONTINUED)
IMPACT OF CHANGES IN ACCOUNTING POLICIES
GROUP
AS
PREVIOUSLY
REPORTED
$M
GROUP
JOINT
ARRANGEMENTS
(SEE (C))
$M
GROUP
DEFINED
BENEFIT
PLANS
(SEE (F))
$M
GROUP
AS
RESTATED
$M
COMPANY
AS
PREVIOUSLY
REPORTED
$M
COMPANY
DEFINED
BENEFIT
PLANS
(SEE (F))
$M
COMPANY
AS
RESTATED
$M
STATEMENT OF COMPREHENSIVE INCOME
FOR THE YEAR TO 30 JUNE 2013
Net profit for the year
Actuarial gains on defined benefit plans
Taxation on above reserve movements
Total items that will not be reclassified to
profit or loss
182
-
-
(6)
-
-
-
-
(1)
13
(2)
11
181
13
(2)
5
349
-
-
-
(1)
13
(2)
11
348
13
(2)
11
Total Other Comprehensive Income for
the Year, Net of Taxation 23 -11 34 38 11 49
Total Comprehensive Income for the Year,
Attributable to Shareholders of the
Parent Company 205 -10 215 387 10 397
STATEMENT OF FINANCIAL POSITION
AS AT 30 JUNE 2013
Other assets
Total Current Assets
Property, plant and equipment
Investments in other entities
Total Non-Current Assets
Total Assets
Other liabilities
Total Current Liabilities
Deferred taxation
Total Non-Current Liabilities
Total Liabilities
98
1,858
2,935
46
3,754
5,612
196
1,710
310
2,086
3,796
-
-
(2)
1
(1)
(1)
-
-
-
-
-
(15)
(15)
-
-
-
(15)
4
4
(5)
(5)
(1)
83
1,843
2,933
47
3,753
5,596
200
1,714
305
2,081
3,795
90
1,767
1,782
368
2,955
4,722
661
2,025
200
1,478
3,503
(15)
(15)
-
-
-
(15)
4
4
(5)
(5)
(1)
75
1,752
1,782
368
2,955
4,707
665
2,029
195
1,473
3,502
Net Assets 1,816 (1) (14) 1,801 1,219 (14) 1,205
Equity
Reserves*
Parent interests
Non-controlling interests
(462)
1,815
1
-
-
(1)
(14)
(14)
-
(476)
1,801
-
(1,066)
1,219
-
(14)
(14)
-
(1,080)
1,205
-
Total Equity 1,816 (1) (14) 1,801 1,219 (14) 1,205
* The impact of the changes in accounting policies was recognised within Retained Deficit.
STATEMENT OF CASH FLOWS
FOR THE YEAR TO 30 JUNE 2013
Cash flows from Operating Activities
Receipts from customers
Payments to suppliers and employees
4,657
(3,841)
(3)
3
-
-
4,654
(3,838)
4,021
(3,419)
-
-
4,021
(3,419)
NOTES TO THE FINANCIAL STATEMENTS (CONTINUED)
FOR THE YEAR TO AND AS AT 30 JUNE 2014