Air New Zealand 2014 Annual Report Download - page 20
Download and view the complete annual report
Please find page 20 of the 2014 Air New Zealand annual report below. You can navigate through the pages in the report by either clicking on the pages listed below, or by using the keyword search tool below to find specific information within the annual report.-
 1
1 -
2
-
3
-
4
-
5
-
6
-
7
-
8
-
9
-
 10
10 -
 11
11 -
 12
12 -
 13
13 -
 14
14 -
 15
15 -
 16
16 -
 17
17 -
 18
18 -
 19
19 -
 20
20 -
 21
21 -
 22
22 -
 23
23 -
 24
24 -
 25
25 -
 26
26 -
 27
27 -
 28
28 -
 29
29 -
 30
30 -
31
-
32
-
33
-
34
-
35
-
36
-
37
-
38
-
39
-
40
-
41
-
42
-
43
-
44
-
45
-
46
-
47
-
48
-
49
-
50
-
51
-
52
-
53
-
54
-
55
-
56
-
57
-
58
-
59
-
60
-
61
-
62
-
63
-
64
-
65
-
66
-
67
-
68
-
69
-
70
-
71
-
72
-
73
-
74
-
75
-
76
-
77
-
78
-
79
-
80
 |
 |

AIR NEW ZEALAND ANNUAL FINANCIAL RESULTS 201418
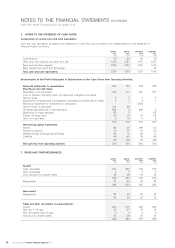
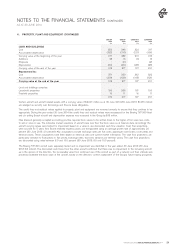
6. NOTES TO THE STATEMENT OF CASH FLOWS
Composition of closing cash and cash equivalents
Cash and cash equivalents, as stated in the Statement of Cash Flows, are reconciled to the related balances in the Statement of
Financial Position as follows:
GROUP
2014
$M
GROUP
2013
$M
COMPANY
2014
$M
COMPANY
2013
$M
Cash balances
Other short term deposits and short term bills
68
1,166
23
1,127
64
1,167
19
1,127
Bank and short term deposits
Bank overdraft and short term borrowings
1,234
-
1,150
-
1,231
-
1,146
(1)
Total cash and cash equivalents 1,234 1,150 1,231 1,145
Reconciliation of Net Profit Attributable to Shareholders to Net Cash Flows from Operating Activities:
Net profit attributable to shareholders
Plus/(less) non-cash items:
Depreciation and amortisation
Loss on disposal of property, plant and equipment, intangibles and assets
held for resale
Impairment on property, plant and equipment, intangibles and assets held for resale
Reversal of impairment on investments in subsidiaries
Share of profit of associates
Unrealised (gains)/losses on fuel derivatives
(Gain)/loss on equity derivative
Foreign exchange gains
Other non-cash items
262
436
2
4
-
(11)
(24)
(5)
(1)
9
181
411
7
7
-
(5)
2
3
(1)
13
532
261
1
2
(150)
-
(24)
-
(1)
5
348
277
5
1
-
-
2
(2)
(2)
8
Net working capital movements:
Assets
Revenue in advance
Deferred foreign exchange (gains)/losses
Liabilities
672
(6)
20
(4)
48
618
31
21
11
69
626
(14)
16
(4)
26
637
50
23
11
68
58 132 24 152
Net cash flow from operating activities 730 750 650 789
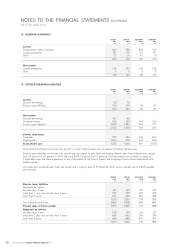
7. TRADE AND OTHER RECEIVABLES
GROUP
2014
$M
GROUP
2013
$M
COMPANY
2014
$M
COMPANY
2013
$M
Current
Trade receivables
Other receivables
Less: allowance for doubtful debts
297
2
(1)
305
3
(2)
274
2
(1)
276
3
(1)
Prepayments
298
51
306
44
275
30
278
24
349 350 305 302
Non-current
Prepayments
55
49
20
12
55 49 20 12
Trade and other receivables is represented by:
Current
Past due 1- 90 days
Past due greater than 90 days
Allowance for doubtful debts
264
33
2
(1)
277
27
4
(2)
243
31
2
(1)
258
18
3
(1)
298 306 275 278
NOTES TO THE FINANCIAL STATEMENTS (CONTINUED)
FOR THE YEAR TO AND AS AT 30 JUNE 2014