Air New Zealand 2014 Annual Report Download - page 19
Download and view the complete annual report
Please find page 19 of the 2014 Air New Zealand annual report below. You can navigate through the pages in the report by either clicking on the pages listed below, or by using the keyword search tool below to find specific information within the annual report.-
 1
1 -
2
-
3
-
4
-
5
-
6
-
7
-
8
-
 9
9 -
 10
10 -
 11
11 -
 12
12 -
 13
13 -
 14
14 -
 15
15 -
 16
16 -
 17
17 -
 18
18 -
 19
19 -
 20
20 -
 21
21 -
 22
22 -
 23
23 -
 24
24 -
 25
25 -
 26
26 -
 27
27 -
 28
28 -
 29
29 -
30
-
31
-
32
-
33
-
34
-
35
-
36
-
37
-
38
-
39
-
40
-
41
-
42
-
43
-
44
-
45
-
46
-
47
-
48
-
49
-
50
-
51
-
52
-
53
-
54
-
55
-
56
-
57
-
58
-
59
-
60
-
61
-
62
-
63
-
64
-
65
-
66
-
67
-
68
-
69
-
70
-
71
-
72
-
73
-
74
-
75
-
76
-
77
-
78
-
79
-
80
 |
 |

AIR NEW ZEALAND ANNUAL FINANCIAL RESULTS 2014 17
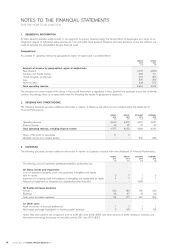
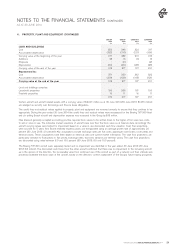
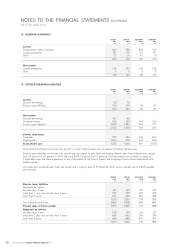
3. EXPENSES (CONTINUED)
GROUP
2014
$M
GROUP
2013
$M
COMPANY
2014
$M
COMPANY
2013
$M
(d) Derivative financial instruments (refer also to Note 20)
Accounting ineffectiveness on cash flow hedges
Components of derivatives excluded from hedge designations
Non-hedge accounted derivatives**
Transfers to net profit from cash flow hedge reserve
(40)
19
92
(48)
7
22
12
(5)
(40)
19
95
(46)
7
22
9
-
Total earnings impact of derivative financial instruments 23 36 28 38
**Largely offset by foreign exchange gains/losses on United States denominated interest-bearing liabilities and aircraft lease return
provisions within “Foreign exchange gains” as noted below.
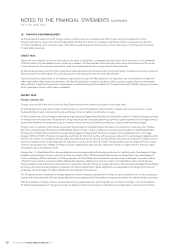
“Foreign exchange gains” as disclosed in the Statement of Financial Performance comprise realised gains/(losses) from operating
hedge derivatives, the translation of monetary assets and liabilities denominated in foreign currencies and ineffective and non-hedge
accounted foreign currency derivatives.
“Normalised earnings”, disclosed as supplementary information at the foot of the Statement of Financial Performance, shows earnings
after excluding movements on derivatives that hedge exposures in other financial periods. The adjustments match derivative gains or
losses with the underlying hedged transaction. Such movements comprise the time value on open derivatives and amounts required to
be recognised as ineffective for accounting purposes (refer Note 20). The amounts recognised in the Statement of Financial Performance
in relation to (gains)/losses on derivatives which hedge exposures in other financial periods are $22 million of gains for fuel derivatives
(30 June 2013: gains of $2 million) and $3 million of gains on foreign exchange derivatives (30 June 2013: losses of $2 million).
4. TAXATION EXPENSE
GROUP
2014
$M
GROUP
2013
$M
COMPANY
2014
$M
COMPANY
2013
$M
Current taxation expense
Current year
Adjustment for prior periods
(155)
(1)
(95)
2
(124)
(3)
(65)
-
(156) (93) (127) (65)
Deferred taxation expense
Origination of temporary differences
61
19
51
23
61 19 51 23
Total taxation expense recognised in earnings (95) (74) (76) (42)
Reconciliation of effective tax rate
Profit before taxation
357
255
608
390
Taxation at 28%
Adjustments
Non-deductible expenses
Non-taxable income
Over/(under) provided in prior periods
Other
(100)
(4)
6
3
-
(72)
(6)
1
2
1
(170)
(2)
99
(2)
(1)
(109)
(3)
70
-
-
Taxation expense (95) (74) (76) (42)
The Group and Company have $146 million imputation credits as at 30 June 2014 (30 June 2013: $41 million in Group and Company).
5. EARNINGS PER SHARE
GROUP
2014
GROUP
2013
Earnings per share attributable to equity holders of the Company
Basic earnings per share (cents)
Diluted earnings per share (cents)
23.8
23.6
16.5
16.4
$M $M
Earnings for the purpose of basic and diluted earnings per share:
Net Profit Attributable to Shareholders of the Parent Company
262
181
Weighted average number of shares (in millions of shares)
Weighted average number of Ordinary Shares for basic earnings per share
Effect of dilutive ordinary shares:
Share options
1,101
11
1,096
8
Weighted average number of Ordinary Shares for diluted earnings per share 1,112 1,104
NOTES TO THE FINANCIAL STATEMENTS (CONTINUED)
FOR THE YEAR TO 30 JUNE 2014