AT&T Wireless 2014 Annual Report Download - page 9
Download and view the complete annual report
Please find page 9 of the 2014 AT&T Wireless annual report below. You can navigate through the pages in the report by either clicking on the pages listed below, or by using the keyword search tool below to find specific information within the annual report.-
 1
1 -
 2
2 -
 3
3 -
 4
4 -
 5
5 -
 6
6 -
 7
7 -
 8
8 -
 9
9 -
 10
10 -
 11
11 -
 12
12 -
 13
13 -
 14
14 -
 15
15 -
 16
16 -
 17
17 -
 18
18 -
 19
19 -
 20
20 -
21
-
22
-
23
-
24
-
25
-
26
-
27
-
28
-
29
-
30
-
31
-
32
-
33
-
34
-
35
-
36
-
37
-
38
-
39
-
40
-
41
-
42
-
43
-
44
-
45
-
46
-
47
-
48
-
49
-
50
-
51
-
52
-
53
-
54
-
55
-
56
-
57
-
58
-
59
-
60
-
61
-
62
-
63
-
64
-
65
-
66
-
67
-
68
-
69
-
70
-
71
-
72
-
73
-
74
-
75
-
76
-
77
-
78
-
79
-
80
-
81
-
82
-
83
-
84
 |
 |

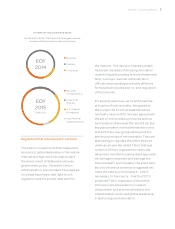
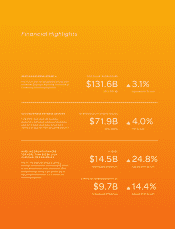
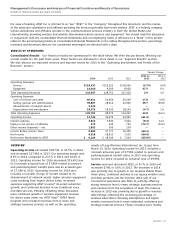
RAMPING REVENUE GROWTH
AT&T’s full-year consolidated revenues grew
more than 3 percent, adjusting for the sale of
Connecticut wireline properties
Financial Highlights
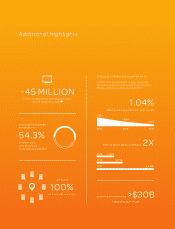
WIRELINE GROWTH DRIVERS
TOP MORE THAN $25 BILLION
IN ANNUALIZED REVENUES
AT&T U-verse and strategic business
services combined for more than $25 billion
in annualized revenues by the end of 2014,
and both are growing in the double digits,
adjusting for the sale of our Connecticut
wireline properties
SOLID BUSINESS REVENUE GROWTH
Total 2014 revenues from business
customers, including wireless and wireline,
were $71.9 billion and grew 4.0 percent,
with fourth-quarter revenues up 5.8 percent
2014 ADJUSTED REVENUES
$131.6B
2013: $127.6B
3.1%
Adjusted YOY Growth
BUSINESS SOLUTIONS REVENUES
$71.9B
2013: $69.1B
4.0%
YOY Growth
U-VERSE
$14.5B
Total Adjusted Revenues
24.8%
Adjusted YOY Growth
STRATEGIC BUSINESS SERVICES
$9.7B
Total Adjusted Revenues
14.4%
Adjusted YOY Growth