AT&T Wireless 2014 Annual Report Download - page 12
Download and view the complete annual report
Please find page 12 of the 2014 AT&T Wireless annual report below. You can navigate through the pages in the report by either clicking on the pages listed below, or by using the keyword search tool below to find specific information within the annual report.-
 1
1 -
 2
2 -
 3
3 -
 4
4 -
 5
5 -
 6
6 -
 7
7 -
 8
8 -
 9
9 -
 10
10 -
 11
11 -
 12
12 -
 13
13 -
 14
14 -
 15
15 -
 16
16 -
 17
17 -
 18
18 -
 19
19 -
 20
20 -
 21
21 -
 22
22 -
23
-
24
-
25
-
26
-
27
-
28
-
29
-
30
-
31
-
32
-
33
-
34
-
35
-
36
-
37
-
38
-
39
-
40
-
41
-
42
-
43
-
44
-
45
-
46
-
47
-
48
-
49
-
50
-
51
-
52
-
53
-
54
-
55
-
56
-
57
-
58
-
59
-
60
-
61
-
62
-
63
-
64
-
65
-
66
-
67
-
68
-
69
-
70
-
71
-
72
-
73
-
74
-
75
-
76
-
77
-
78
-
79
-
80
-
81
-
82
-
83
-
84
 |
 |

10
|
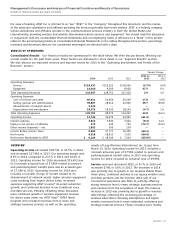
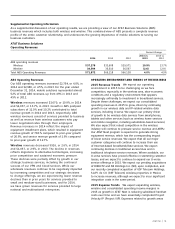
AT&T INC.
Selected Financial and Operating Data
Dollars in millions except per share amounts
At December 31 and for the year ended: 2014 2013 2012 2011 2010
Financial Data
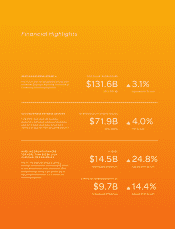
Operating revenues $132,447 $128,752 $127,434 $126,723 $124,280
Operating expenses $120,701 $ 98,273 $114,437 $117,505 $104,707
Operating income $ 11,746 $ 30,479 $ 12,997 $ 9,218 $ 19,573
Interest expense $ 3,613 $ 3,940 $ 3,444 $ 3,535 $ 2,994
Equity in net income of affiliates $ 175 $ 642 $ 752 $ 784 $ 762
Other income – net $ 1,652 $ 596 $ 134 $ 249 $ 897
Income tax expense (benefit) $ 3,442 $ 9,224 $ 2,900 $ 2,532 $ (1,162)
Net Income $ 6,518 $ 18,553 $ 7,539 $ 4,184 $ 20,179
Less: Net Income Attributable to
Noncontrolling Interest $ (294) $ (304) $ (275) $ (240) $ (315)
Net Income Attributable to AT&T $ 6,224 $ 18,249 $ 7,264 $ 3,944 $ 19,864
Earnings Per Common Share:
Net Income Attributable to AT&T $ 1.19 $ 3.39 $ 1.25 $ 0.66 $ 3.36
Earnings Per Common Share – Assuming Dilution:
Net Income Attributable to AT&T $ 1.19 $ 3.39 $ 1.25 $ 0.66 $ 3.35
Total assets $292,829 $277,787 $272,315 $270,442 $269,473
Long-term debt $ 76,011 $ 69,290 $ 66,358 $ 61,300 $ 58,971
Total debt $ 82,067 $ 74,788 $ 69,844 $ 64,753 $ 66,167
Construction and capital expenditures $ 21,433 $ 21,228 $ 19,728 $ 20,272 $ 20,302
Dividends declared per common share $ 1.85 $ 1.81 $ 1.77 $ 1.73 $ 1.69
Book value per common share $ 16.76 $ 17.50 $ 16.61 $ 17.85 $ 18.94
Ratio of earnings to fixed charges 2.83 5.98 2.96 2.23 4.57
Debt ratio 48.6% 45.0% 43.0% 38.0% 37.1%
Weighted-average common shares outstanding (000,000) 5,205 5,368 5,801 5,928 5,913
Weighted-average common shares
outstanding with dilution (000,000) 5,221 5,385 5,821 5,950 5,938
End of period common shares outstanding (000,000) 5,187 5,226 5,581 5,927 5,911
Operating Data
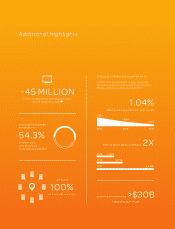
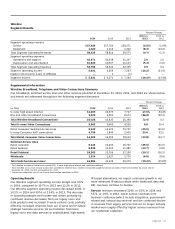
Wireless subscribers (000)1 120,554 110,376 106,957 103,247 95,536
In-region network access lines in service (000) 19,896 24,639 29,279 34,054 39,211
Broadband connections (000)2 16,028 16,425 16,390 16,427 16,309
Number of employees 243,620 243,360 241,810 256,420 266,590
1 The number presented represents 100% of AT&T Mobility wireless subscribers.
2 Broadband connections include in-region U-verse high speed Internet access, in-region DSL lines and satellite broadband.