AT&T Wireless 2014 Annual Report Download - page 14
Download and view the complete annual report
Please find page 14 of the 2014 AT&T Wireless annual report below. You can navigate through the pages in the report by either clicking on the pages listed below, or by using the keyword search tool below to find specific information within the annual report.-
 1
1 -
2
-
3
-
 4
4 -
 5
5 -
 6
6 -
 7
7 -
 8
8 -
 9
9 -
 10
10 -
 11
11 -
 12
12 -
 13
13 -
 14
14 -
 15
15 -
 16
16 -
 17
17 -
 18
18 -
 19
19 -
 20
20 -
 21
21 -
 22
22 -
 23
23 -
 24
24 -
25
-
26
-
27
-
28
-
29
-
30
-
31
-
32
-
33
-
34
-
35
-
36
-
37
-
38
-
39
-
40
-
41
-
42
-
43
-
44
-
45
-
46
-
47
-
48
-
49
-
50
-
51
-
52
-
53
-
54
-
55
-
56
-
57
-
58
-
59
-
60
-
61
-
62
-
63
-
64
-
65
-
66
-
67
-
68
-
69
-
70
-
71
-
72
-
73
-
74
-
75
-
76
-
77
-
78
-
79
-
80
-
81
-
82
-
83
-
84
 |
 |

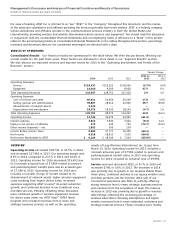
Management’s Discussion and Analysis of Financial Condition and Results of Operations (continued)
Dollars in millions except per share amounts
12
|
AT&T INC.
The 2013 expense decreased by $12,757 as a result of
recording actuarial gains in 2013 and actuarial losses
in 2012. Expense reductions in 2013 also reflect lower
employee-related Wireline costs, gains on spectrum
transactions, lower financing-related costs associated
with our pension and postretirement benefits (referred
to as Pension/OPEB expenses) and the sale of our
Advertising Solutions segment. These decreases were
partially offset by increased charges for employee
separations and higher selling and advertising expenses.
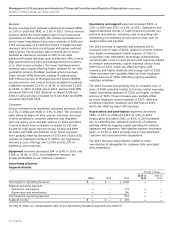
Abandonment of network assets In 2014, we recorded
a noncash charge of $2,120 for the abandonment in place
of certain network assets (see Note 6). During the fourth
quarter of 2014, we completed a study of our network
assets and determined that specific copper assets will not
be necessary to support future network activity, due to
declining customer demand for our legacy voice and data
products and the transition of our networks to next
generation IP-based technology.
Depreciation and amortization expense decreased
$122, or 0.7%, in 2014 and increased $252, or 1.4%, in
2013. The 2014 expense decrease was primarily due to
extending the estimated useful life of software, an
increase in fully depreciated assets and lower amortization
of intangibles for customer lists. These decreases were
largely offset by ongoing capital spending for network
upgrades and expansion and additional expense associated
with the assets acquired from Leap.
The 2013 expense increase was primarily due to ongoing
capital spending for network upgrades and expansion,
partially offset by fully depreciated assets and lower
amortization of intangibles for customer lists and the
sale of our Advertising Solutions segment.
Interest expense decreased $327, or 8.3%, in 2014 and
increased $496, or 14.4%, in 2013. The decrease in 2014
was primarily due to a $581 charge related to debt tender
offers in 2013 and lower interest rates resulting from
refinancing activity, partially offset by interest expense
related to our December 2013 tower transaction (see
Note 17), higher debt balances and charges associated
with the early redemption of debt during 2014.
The increase in interest expense for 2013 was primarily
due to a $581 charge related to our debt tender offers
in 2013, partially offset by charges associated with early
debt redemptions in 2012. Lower average interest rates
offset higher average debt balances.
offset by continued declines in revenues from legacy
wireline voice and data services and the loss of revenues
resulting from the sale of our Advertising Solutions
segment in 2012.
The telecommunications industry is rapidly evolving from
fixed location, voice-oriented services into an industry
driven by customer demand for instantly available, data-
based services (including video). We have been investing
heavily to expand our broadband network and upgrade
our wireless network to meet this demand. We have also
launched new wireless offerings to give our customers
additional choices for data and handset purchase plans.
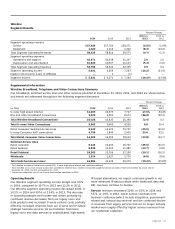
Equipment revenues increased $4,510, or 47.5%, in 2014
and $572, or 6.4%, in 2013. Growth in equipment revenues
reflected the continuing trend by our postpaid wireless
subscribers to choose devices on installment purchase
rather than the device subsidy model, which resulted in
increased equipment revenue recognized for device sales.
The revenue increase in 2013 was primarily due to growth
in wireless equipment revenues, reflecting the increasing
percentage of wireless subscribers choosing smartphones.
Cost of services and sales expenses increased $9,147,
or 17.8%, in 2014 and decreased $3,764, or 6.8%, in 2013.
The 2014 expense increased by $4,406 as a result of
recording actuarial losses in 2014 and actuarial gains in
2013. Wireless handset sales and upgrades contributed
to higher equipment costs and handset insurance costs in
2014. The increase also reflects higher wireless network
costs and wireline costs attributable to U-verse content
costs and subscriber growth and employee-related charges.
The 2013 expense decreased by $4,822 as a result of
recording actuarial gains in 2013 and losses in 2012.
Lower interconnect and long-distance expenses, lower costs
associated with Universal Service Fund (USF) fees and the
sale of our Advertising Solutions segment also contributed
to expense declines in 2013. These decreases were partially
offset by increased wireless equipment costs related to
device sales and increased wireline costs attributable to
growth in U-verse subscribers.
Selling, general and administrative expenses increased
$11,283, or 39.7%, in 2014 and decreased $12,652, or
30.8%, in 2013. The 2014 expense increased by $11,047
as a result of recording actuarial losses in 2014 and
actuarial gains in 2013. Expense increases in 2014 also
reflect higher selling and administrative expenses in our
Wireless segment and gains on spectrum transactions
in 2013. These increases were partially offset by lower
employee-related costs and Wireless commissions expenses.