AT&T Wireless 2014 Annual Report Download - page 77
Download and view the complete annual report
Please find page 77 of the 2014 AT&T Wireless annual report below. You can navigate through the pages in the report by either clicking on the pages listed below, or by using the keyword search tool below to find specific information within the annual report.-
 1
1 -
2
-
3
-
4
-
5
-
6
-
7
-
8
-
9
-
10
-
11
-
12
-
13
-
14
-
15
-
16
-
17
-
18
-
19
-
20
-
21
-
22
-
23
-
24
-
25
-
26
-
27
-
28
-
29
-
30
-
31
-
32
-
33
-
34
-
35
-
36
-
37
-
38
-
39
-
40
-
41
-
42
-
43
-
44
-
45
-
46
-
47
-
48
-
49
-
50
-
51
-
52
-
53
-
54
-
55
-
56
-
57
-
58
-
59
-
60
-
61
-
62
-
63
-
64
-
65
-
66
-
 67
67 -
 68
68 -
 69
69 -
 70
70 -
 71
71 -
 72
72 -
 73
73 -
 74
74 -
 75
75 -
 76
76 -
 77
77 -
 78
78 -
 79
79 -
 80
80 -
 81
81 -
 82
82 -
 83
83 -
 84
84
 |
 |

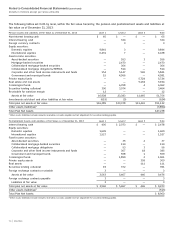
AT&T INC.
|
75
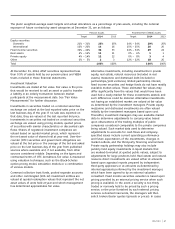
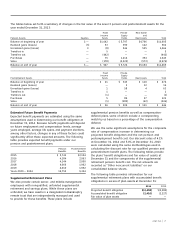
NOTE 19. QUARTERLY FINANCIAL INFORMATION (UNAUDITED)
The following tables represent our quarterly financial results:
2014 Calendar Quarter
First Second Third Fourth2 Annual
Total Operating Revenues $32,476 $32,575 $32,957 $34,439 $132,447
Operating Income (Loss) 6,278 5,616 5,402 (5,550) 11,746
Net Income (Loss) 3,734 3,621 3,059 (3,896) 6,518
Net Income (Loss) Attributable to AT&T 3,652 3,547 3,002 (3,977) 6,224
Basic Earnings (Loss) Per Share Attributable to AT&T1 $ 0.70 $ 0.68 $ 0.58 $ (0.77) $ 1.19
Diluted Earnings (Loss) Per Share Attributable to AT&T1 $ 0.70 $ 0.68 $ 0.58 $ (0.77) $ 1.19
Stock Price
High $ 35.50 $ 36.86 $ 37.48 $ 36.16
Low 31.74 34.32 34.17 32.07
Close 35.07 35.36 35.24 33.59
1 Quarterly earnings per share impacts may not add to full-year earnings per share impacts due to the difference in weighted-average common shares for the quarters versus
the weighted-average common shares for the year.
2 Includes an actuarial loss on pension and postretirement benefit plans (Note 12) and asset abandonment charges (Note 6).
2013 Calendar Quarter
First Second Third Fourth2 Annual
Total Operating Revenues $31,356 $32,075 $32,158 $33,163 $128,752
Operating Income 5,940 6,113 6,188 12,238 30,479
Net Income 3,773 3,880 3,905 6,995 18,553
Net Income Attributable to AT&T 3,700 3,822 3,814 6,913 18,249
Basic Earnings Per Share Attributable to AT&T1 $ 0.67 $ 0.71 $ 0.72 $ 1.31 $ 3.39
Diluted Earnings Per Share Attributable to AT&T1 $ 0.67 $ 0.71 $ 0.72 $ 1.31 $ 3.39
Stock Price
High $ 36.87 $ 39.00 $ 36.31 $ 36.80
Low 32.76 34.10 33.19 33.09
Close 36.69 35.40 33.82 35.16
1 Quarterly earnings per share impacts may not add to full-year earnings per share impacts due to the difference in weighted-average common shares for the quarters versus
the weighted-average common shares for the year.
2 Includes an actuarial gain on pension and postretirement benefit plans (Note 12), special termination charges (Note 12) and charges for employee separations.
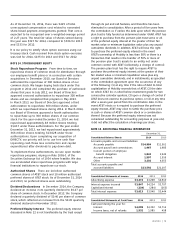
sheet. In our opinion, although the outcomes of these
proceedings are uncertain, they should not have a material
adverse effect on our financial position, results of
operations or cash flows.
We have contractual obligations to purchase certain goods
or services from various other parties. Our purchase
obligations are expected to be approximately $19,129 in
2015, $21,386 in total for 2016 and 2017, $2,518 in total
for 2018 and 2019 and $691 in total for years thereafter.
See Note 10 for a discussion of collateral and credit-risk
contingencies.
Lease payments under the sublease arrangements were
$221 for 2014. At December 31, 2014, the future minimum
payments under the sublease arrangement are $225 for
2015, $229 for 2016, $234 for 2017, $239 for 2018,
$244 for 2019, and $2,553 thereafter.
NOTE 18. CONTINGENT LIABILITIES
We are party to numerous lawsuits, regulatory proceedings
and other matters arising in the ordinary course of business.
In evaluating these matters on an ongoing basis, we take
into account amounts already accrued on the balance