AT&T Wireless 2014 Annual Report Download - page 18
Download and view the complete annual report
Please find page 18 of the 2014 AT&T Wireless annual report below. You can navigate through the pages in the report by either clicking on the pages listed below, or by using the keyword search tool below to find specific information within the annual report.-
 1
1 -
2
-
3
-
4
-
5
-
6
-
7
-
 8
8 -
 9
9 -
 10
10 -
 11
11 -
 12
12 -
 13
13 -
 14
14 -
 15
15 -
 16
16 -
 17
17 -
 18
18 -
 19
19 -
 20
20 -
 21
21 -
 22
22 -
 23
23 -
 24
24 -
 25
25 -
 26
26 -
 27
27 -
 28
28 -
29
-
30
-
31
-
32
-
33
-
34
-
35
-
36
-
37
-
38
-
39
-
40
-
41
-
42
-
43
-
44
-
45
-
46
-
47
-
48
-
49
-
50
-
51
-
52
-
53
-
54
-
55
-
56
-
57
-
58
-
59
-
60
-
61
-
62
-
63
-
64
-
65
-
66
-
67
-
68
-
69
-
70
-
71
-
72
-
73
-
74
-
75
-
76
-
77
-
78
-
79
-
80
-
81
-
82
-
83
-
84
 |
 |

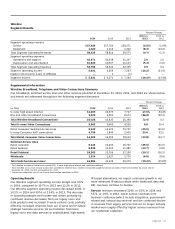
Management’s Discussion and Analysis of Financial Condition and Results of Operations (continued)
Dollars in millions except per share amounts
16
|
AT&T INC.
as a decrease in national equipment activation credits.
These decreases are partially offset by an increase due
to Cricket, postpaid gross activations and upgrades.
The increase in 2013 was primarily due to the following:
• Equipment costs increased $817, reflecting sales
of more expensive smartphones, partially offset by
the overall decline in upgrade activity and total
device sales.
• Selling expenses (other than commissions) and
administrative expenses increased $712 due primarily
to a $265 increase in employee-related costs, a
$246 increase in advertising costs, $187 increase in
information technology costs in conjunction with
ongoing support systems development, and $107
increase in nonemployee-related costs, partially
offset by an $84 decrease in bad debt expense.
• Commission expenses increased $59 due to a year-
over-year increase in smartphone sales as a
percentage of total device sales, partially offset by
the overall decline in handset upgrade activity and
total device sales.
Partially offsetting these increases were the following:
• Long-distance costs decreased $130 due to third-party
credits and lower usage costs.
• USF fees decreased $104 primarily due to USF rate
decreases, which are offset by lower USF revenues.
• Network system costs decreased $77 primarily due
to lower interconnect costs partially offset by higher
network traffic, personnel-related network support
costs and cell site related costs in conjunction with
our network enhancement efforts.
• Incollect roaming fees decreased $73 primarily due
to rate declines and lower roaming use associated
with the integration of previously acquired subscribers
into our network.
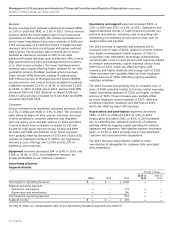
Depreciation and amortization expenses increased $473,
or 6.3%, in 2014 and $595, or 8.7%, in 2013. In 2014,
depreciation expense increased $494, or 6.8%, primarily
due to ongoing capital spending for network upgrades
and expansions and the acquisition of Leap partially offset
by certain network assets becoming fully depreciated
and extending the estimated useful life of software.
Amortization expense decreased $21, or 9.6%, primarily
due to lower amortization of intangibles for customer
lists related to acquisitions.
Depreciation expense increased $865, or 13.5%, in 2013
primarily due to ongoing capital spending for network
upgrades and expansions partially offset by certain
network assets becoming fully depreciated. Amortization
expense decreased $270, or 55.3%, in 2013 primarily
due to lower amortization of intangibles for customer
lists related to acquisitions.
under our Mobile Share plans. This decrease was largely
offset by revenues from Cricket subscribers that were not
included in our 2013 results. The increase in 2013 was
primarily due to a higher number of subscribers using
smartphones and data-centric devices. While we expect
monthly service revenues to continue to be pressured
as customers move to Mobile Share plans, we expect
equipment revenues to increase for those subscribers
who elect the AT&T Next program.
Equipment revenues increased $4,613, or 55.3%, in 2014
and $770, or 10.2%, in 2013. The increase in 2014 was
primarily related to the increase in devices sold under our
AT&T Next program and also the increase in smartphone
sales and sales to Cricket customers. During the second
quarter of 2014, with the launch of the AT&T Next program
through other distributors, we began deferring the
recognition of equipment revenue and costs on sales to
distributors until the device is sold to the end subscriber
and the trade-in right is conveyed. This lag in timing of the
recognition of the sale resulted in lower revenue through
these distributors beginning in the second quarter of 2014.
The increase in 2013 was primarily driven by the increased
number of smartphones as a percentage of total device
sales to postpaid subscribers.
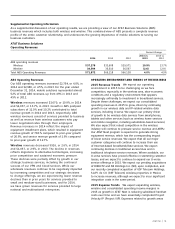
Operations and support expenses increased $4,416, or
9.9%, in 2014 and $1,212, or 2.8%, in 2013. The increase in
2014, which includes the incremental costs related to
integrating Leap, was primarily due to the following:
• Equipment costs increased $2,664, reflecting the sales
of more expensive smartphones. Equipment costs also
include Cricket and Alltel subscriber integration charges,
which we expect will continue into 2015 as we complete
the migration of those subscribers to our network.
• Selling (other than commissions) and administrative
expenses increased $1,060 due primarily to increases
of: $261 in sales and marketing expense; $279 in
professional, administrative and legal costs; $252 in
customer service and retention cost; and $125 in
bad debt expense resulting from higher volumes
of equipment installment sales.
• Network system costs increased $578 due to
increased lease fees, higher maintenance and energy
costs resulting from the increase in the number
of cell sites and expenses related to our network
enhancement efforts. These increases were partially
offset by lower interconnect costs resulting from
our ongoing network transition to more efficient
Ethernet/IP-based technologies.
• Handset insurance cost increased $407 due to an
increase in the cost of replacement phones.
Partially offsetting these increases were lower commission
expenses of $486, which were primarily due to lower average
commission rates paid under the AT&T Next program as well