AT&T Wireless 2014 Annual Report Download - page 74
Download and view the complete annual report
Please find page 74 of the 2014 AT&T Wireless annual report below. You can navigate through the pages in the report by either clicking on the pages listed below, or by using the keyword search tool below to find specific information within the annual report.-
 1
1 -
2
-
3
-
4
-
5
-
6
-
7
-
8
-
9
-
10
-
11
-
12
-
13
-
14
-
15
-
16
-
17
-
18
-
19
-
20
-
21
-
22
-
23
-
24
-
25
-
26
-
27
-
28
-
29
-
30
-
31
-
32
-
33
-
34
-
35
-
36
-
37
-
38
-
39
-
40
-
41
-
42
-
43
-
44
-
45
-
46
-
47
-
48
-
49
-
50
-
51
-
52
-
53
-
54
-
55
-
56
-
57
-
58
-
59
-
60
-
61
-
62
-
63
-
 64
64 -
 65
65 -
 66
66 -
 67
67 -
 68
68 -
 69
69 -
 70
70 -
 71
71 -
 72
72 -
 73
73 -
 74
74 -
 75
75 -
 76
76 -
 77
77 -
 78
78 -
 79
79 -
 80
80 -
 81
81 -
 82
82 -
 83
83 -
 84
84
 |
 |

Notes to Consolidated Financial Statements (continued)
Dollars in millions except per share amounts
72
|
AT&T INC.
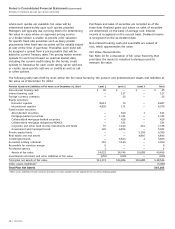
The following tables present the components of net periodic
benefit cost and other changes in plan assets and benefit
obligations recognized in OCI:
Net Periodic Benefit Cost 2014 2013 2012
Service cost – benefits earned
during the period $ 7 $ 9 $ 10
Interest cost on projected
benefit obligation 109 101 116
Amortization of prior
service cost (credit) (1) — —
Actuarial (gain) loss 243 (106) 230
Net supplemental retirement
pension cost $358 $ 4 $356
Other Changes Recognized in
Other Comprehensive Income 2014 2013 2012
Prior service (cost) credit $ (11) $ (1) $ (1)
Amortization of prior
service cost (credit) (1) — —
Total recognized in other
comprehensive (income)
loss (net of tax) $ (12) $ (1) $ (1)
The estimated prior service cost for our supplemental
retirement plan benefits that will be amortized from
accumulated OCI into net periodic benefit cost over the
next fiscal year is $1.
Deferred compensation expense was $121 in 2014, $122 in
2013 and $118 in 2012. Our deferred compensation liability,
included in “Other noncurrent liabilities,” was $1,156 at
December 31, 2014, and $1,118 at December 31, 2013.
Contributory Savings Plans
We maintain contributory savings plans that cover
substantially all employees. Under the savings plans, we
match in cash or company stock a stated percentage of
eligible employee contributions, subject to a specified
ceiling. There are no debt-financed shares held by the
Employee Stock Ownership Plans, allocated or unallocated.
Our match of employee contributions to the savings plans
is fulfilled with purchases of our stock on the open market
or company cash. Benefit cost is based on the cost of
shares or units allocated to participating employees’
accounts and was $654, $654 and $634 for the years
ended December 31, 2014, 2013 and 2012.
NOTE 13. SHARE-BASED PAYMENTS
Under our various plans, senior and other management
employees and nonemployee directors have received
nonvested stock and stock units. We grant performance
stock units, which are nonvested stock units, based upon our
stock price at the date of grant and award them in the form
of AT&T common stock and cash at the end of a three-year
period, subject to the achievement of certain performance
goals. We treat the cash portion of these awards as a
liability. We grant forfeitable restricted stock and stock
units, which are valued at the market price of our common
stock at the date of grant and vest typically over a two- to
seven-year period. We also grant other nonvested stock
units and award them in cash at the end of a three-year
period, subject to the achievement of certain market based
conditions. As of December 31, 2014, we were authorized
to issue up to approximately 117 million shares of common
stock (in addition to shares that may be issued upon exercise
of outstanding options or upon vesting of performance stock
units or other nonvested stock units) to officers, employees
and directors pursuant to these various plans.
We account for our share-based payment arrangements
based on the fair value of the awards on their respective
grant date, which may affect our ability to fully realize the
value shown on our consolidated balance sheets of deferred
tax assets associated with compensation expense. We record
a valuation allowance when our future taxable income is not
expected to be sufficient to recover the asset. Accordingly,
there can be no assurance that the current stock price of
our common shares will rise to levels sufficient to realize
the entire tax benefit currently reflected on our consolidated
balance sheets. However, to the extent we generate excess
tax benefits (i.e., that additional tax benefits in excess of
the deferred taxes associated with compensation expense
previously recognized) the potential future impact on
income would be reduced.
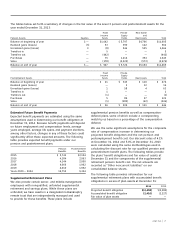
The compensation cost recognized for those plans was
included in operating expenses in our consolidated
statements of income, as reflected in the table below.
The total income tax benefit recognized in the consolidated
statements of income for share-based payment
arrangements was $122 for 2014, compared to $175 for
2013 and $195 for 2012.
2014 2013 2012
Performance stock units $226 $381 $397
Restricted stock and stock units 93 80 102
Other nonvested stock units (1) (3) 12
Total $318 $458 $511
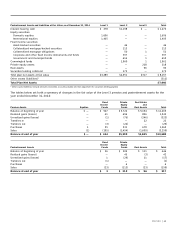
A summary of the status of our nonvested stock units as
of December 31, 2014, and changes during the year then
ended is presented as follows (shares in millions):
Weighted-Average
Nonvested Stock Units Shares Grant-Date Fair Value
Nonvested at January 1, 2014 24 $ 31.93
Granted 14 33.39
Vested (11) 29.91
Forfeited (1) 32.60
Nonvested at December 31, 2014 26 $33.52