AT&T Wireless 2014 Annual Report Download - page 20
Download and view the complete annual report
Please find page 20 of the 2014 AT&T Wireless annual report below. You can navigate through the pages in the report by either clicking on the pages listed below, or by using the keyword search tool below to find specific information within the annual report.-
 1
1 -
2
-
3
-
4
-
5
-
6
-
7
-
8
-
9
-
 10
10 -
 11
11 -
 12
12 -
 13
13 -
 14
14 -
 15
15 -
 16
16 -
 17
17 -
 18
18 -
 19
19 -
 20
20 -
 21
21 -
 22
22 -
 23
23 -
 24
24 -
 25
25 -
 26
26 -
 27
27 -
 28
28 -
 29
29 -
 30
30 -
31
-
32
-
33
-
34
-
35
-
36
-
37
-
38
-
39
-
40
-
41
-
42
-
43
-
44
-
45
-
46
-
47
-
48
-
49
-
50
-
51
-
52
-
53
-
54
-
55
-
56
-
57
-
58
-
59
-
60
-
61
-
62
-
63
-
64
-
65
-
66
-
67
-
68
-
69
-
70
-
71
-
72
-
73
-
74
-
75
-
76
-
77
-
78
-
79
-
80
-
81
-
82
-
83
-
84
 |
 |

Management’s Discussion and Analysis of Financial Condition and Results of Operations (continued)
Dollars in millions except per share amounts
18
|
AT&T INC.
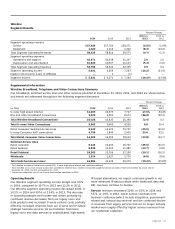
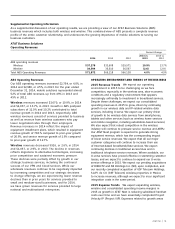
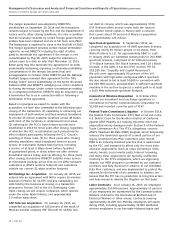
Advertising Solutions
Segment Results
Percent Change
2014 vs. 2013 vs.
2014 2013 2012 2013 2012
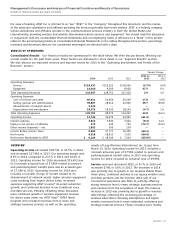
Total Segment Operating Revenues $ — $ — $ 1,049 — —
Segment operating expenses
Operations and support — — 773 — —
Depreciation and amortization — — 106 — —
Total Segment Operating Expenses — — 879 — —
Segment Income $ — $ — $ 170 — —
On May 8, 2012, we completed the sale of our Advertising Solutions segment (see Note 5).
Operations and support expenses increased $833, or
2.0%, in 2014 and $431, or 1.0%, in 2013. Operations and
support expenses consist of costs incurred to provide our
products and services, including costs of operating and
maintaining our networks and personnel costs, such as
compensation and benefits.
The 2014 increase in expenses was primarily due to
increased cost of sales of $621, related to U-verse content
fees; higher nonemployee-related expense of $362 in
conjunction with information technology enhancements,
overall growth of our U-verse services and expenses related
to network enhancements; higher Universal Service Fund
(USF) fees of $157, which are offset by higher USF
revenues; and higher materials and energy costs of $102.
These increases were partially offset by lower employee-
related expense of $396, reflecting ongoing workforce
reduction initiatives.
The 2013 increase was primarily due to increased cost of
sales of $680, primarily related to U-verse related expenses;
higher advertising expenses of $155; and higher contract
services of $125. These increases were partially offset
by lower employee-related expense of $437, reflecting
workforce reduction initiatives, and USF fees of $116,
which are offset by lower USF revenues.
Depreciation and amortization expenses decreased
$584, or 5.4%, in 2014 and $216, or 1.9%, in 2013.
Depreciation decreased $441, or 4.2%, in 2014 primarily
due to extending the estimated useful life of software,
partially offset by ongoing capital spending for network
upgrades and expansion. Amortization expense decreased
$143, or 33.3%, in 2014 primarily due to fully amortized
customer lists associated with acquisitions.
The 2013 decrease was primarily related to lower
amortization of intangibles for customer lists associated
with acquisitions.
Business
Service revenues from business customers decreased $848,
or 2.5%, in 2014 and $891, or 2.5%, in 2013. Service revenue
declines reflect the fourth-quarter sale of our Connecticut
operations. In 2014 and 2013, the revenue decreases were
due to lower long-distance and voice revenues of $681 and
$721 and declines of $1,229 and $1,012 in traditional data
revenues, which include circuit-based and packet-switched
data services. The decreases were primarily due to lower
demand as customers continue to shift to our most
advanced IP-based offerings, such as Ethernet, VPN, U-verse
high speed Internet access and managed Internet services,
or to other service providers. The lower traditional service
revenues were largely offset by higher demand for our next
generation services. Strategic business service revenues,
which include VPNs, Ethernet, hosting, IP conferencing,
VoIP, Ethernet-access to Managed Internet Service (EaMIS),
security services, and U-verse services provided to business
customers increased $1,220, or 14.4%, in 2014 and $1,105,
or 15.0%, in 2013. In 2014 and in 2013, revenue from VPN
increased $359 and $361, Ethernet increased $338 and
$310, U-verse services increased $173 and $143 and EaMIS
increased $163 and $126.
Consumer
Service revenues from residential customers increased $603,
or 2.7%, in 2014 and $548, or 2.5%, in 2013. The increases
were driven by higher IP data revenue reflecting increased
U-verse penetration, customer additions, and migration
from our legacy voice and DSL services. In 2014 and 2013,
U-verse revenue from consumers increased $1,315 and
$1,289 for high-speed Internet access, $1,024 and $995
for video and $384 and $282 for voice. These increases
were partially offset by decreases of $729 and $616 in DSL
revenue as customers continue to shift to our high-speed
Internet access offerings and $1,418 and $1,379 in
traditional voice revenues.
Equipment revenues decreased $94, or 8.4%, in 2014, and
$188, or 14.4%, in 2013. Our equipment revenues are
mainly attributable to our business customers.