AT&T Wireless 2014 Annual Report Download - page 13
Download and view the complete annual report
Please find page 13 of the 2014 AT&T Wireless annual report below. You can navigate through the pages in the report by either clicking on the pages listed below, or by using the keyword search tool below to find specific information within the annual report.-
 1
1 -
2
-
 3
3 -
 4
4 -
 5
5 -
 6
6 -
 7
7 -
 8
8 -
 9
9 -
 10
10 -
 11
11 -
 12
12 -
 13
13 -
 14
14 -
 15
15 -
 16
16 -
 17
17 -
 18
18 -
 19
19 -
 20
20 -
 21
21 -
 22
22 -
 23
23 -
24
-
25
-
26
-
27
-
28
-
29
-
30
-
31
-
32
-
33
-
34
-
35
-
36
-
37
-
38
-
39
-
40
-
41
-
42
-
43
-
44
-
45
-
46
-
47
-
48
-
49
-
50
-
51
-
52
-
53
-
54
-
55
-
56
-
57
-
58
-
59
-
60
-
61
-
62
-
63
-
64
-
65
-
66
-
67
-
68
-
69
-
70
-
71
-
72
-
73
-
74
-
75
-
76
-
77
-
78
-
79
-
80
-
81
-
82
-
83
-
84
 |
 |

AT&T INC.
|
11
Management’s Discussion and Analysis of Financial Condition and Results of Operations
Dollars in millions except per share amounts
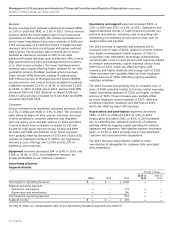
results of Leap Wireless International, Inc. (Leap) from
March 13, 2014. Operating income for 2013 included a
noncash actuarial gain of $7,584 related to pension and
postemployment benefit plans in 2013 and operating
income for 2012 included an actuarial loss of $9,994.
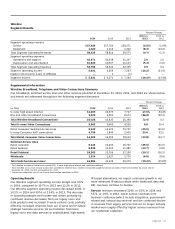
Service revenues decreased $815, or 0.7%, in 2014 and
increased $746, or 0.6%, in 2013. The decrease in 2014
was primarily due to growth in our wireless Mobile Share
Value plans, continued declines in our legacy wireline voice
and data products and the October 2014 sale of our
Connecticut operations (see Note 5), partially offset by
strong revenues from U-verse, strategic business services
and revenues from the acquisition of Leap. The revenue
increase in 2013 was primarily due to growth in wireless
data billings, reflecting the increasing percentage of
wireless subscribers choosing smartphones and higher
wireline revenues from U-verse residential customers and
strategic business services. These increases were mostly
OVERVIEW
Operating income decreased $18,733, or 61.5%, in 2014
and increased $17,482 in 2013. Our operating margin was
8.9% in 2014, compared to 23.7% in 2013 and 10.2% in
2012. Operating income for 2014 decreased $15,453 due
to a noncash actuarial loss of $7,869 related to pension
and postemployment benefit plans and an actuarial gain
of $7,584 in 2013. Operating income for 2014 also
includes a noncash charge of $2,120 related to an
abandonment of network assets, higher wireless equipment
costs resulting from higher device sales, increased
expenses supporting AT&T U-verse® (U-verse) subscriber
growth, and continued declines in our traditional voice
and data services. Partially offsetting these decreases
were continued growth in wireless equipment revenue
for device sales under our AT&T NextSM (AT&T Next)
program and increased revenues from U-verse and
strategic business services, as well as the operating
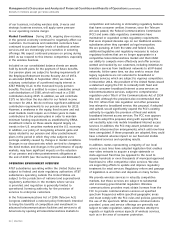
For ease of reading, AT&T Inc. is referred to as “we,” “AT&T” or the “Company” throughout this document, and the names
of the particular subsidiaries and affiliates providing the services generally have been omitted. AT&T is a holding company
whose subsidiaries and affiliates operate in the communications services industry in both the United States and
internationally, providing wireless and wireline telecommunications services and equipment. You should read this discussion
in conjunction with the consolidated financial statements and accompanying notes. A reference to a “Note” in this section
refers to the accompanying Notes to Consolidated Financial Statements. In the tables throughout this section, percentage
increases and decreases that are not considered meaningful are denoted with a dash.
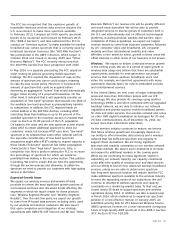
RESULTS OF OPERATIONS
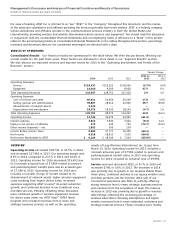
Consolidated Results Our financial results are summarized in the table below. We then discuss factors affecting our
overall results for the past three years. These factors are discussed in more detail in our “Segment Results” section.
We also discuss our expected revenue and expense trends for 2015 in the “Operating Environment and Trends of the
Business” section.
Percent Change
2014 vs. 2013 vs.
2014 2013 2012 2013 2012
Operating Revenues
Service $118,437 $119,252 $118,506 (0.7)% 0.6%
Equipment 14,010 9,500 8,928 47.5 6.4
Total Operating Revenues 132,447 128,752 127,434 2.9 1.0
Operating Expenses
Cost of services and sales 60,611 51,464 55,228 17.8 (6.8)
Selling, general and administrative 39,697 28,414 41,066 39.7 (30.8)
Abandonment of network assets 2,120 — — — —
Depreciation and amortization 18,273 18,395 18,143 (0.7) 1.4
Total Operating Expenses 120,701 98,273 114,437 22.8 (14.1)
Operating Income 11,746 30,479 12,997 (61.5) —
Interest expense 3,613 3,940 3,444 (8.3) 14.4
Equity in net income of affiliates 175 642 752 (72.7) (14.6)
Other income (expense) – net 1,652 596 134 — —
Income Before Income Taxes 9,960 27,777 10,439 (64.1) —
Net Income 6,518 18,553 7,539 (64.9) —
Net Income Attributable to AT&T $ 6,224 $ 18,249 $ 7,264 (65.9)% —