AT&T Wireless 2014 Annual Report Download - page 16
Download and view the complete annual report
Please find page 16 of the 2014 AT&T Wireless annual report below. You can navigate through the pages in the report by either clicking on the pages listed below, or by using the keyword search tool below to find specific information within the annual report.-
 1
1 -
2
-
3
-
4
-
5
-
 6
6 -
 7
7 -
 8
8 -
 9
9 -
 10
10 -
 11
11 -
 12
12 -
 13
13 -
 14
14 -
 15
15 -
 16
16 -
 17
17 -
 18
18 -
 19
19 -
 20
20 -
 21
21 -
 22
22 -
 23
23 -
 24
24 -
 25
25 -
 26
26 -
27
-
28
-
29
-
30
-
31
-
32
-
33
-
34
-
35
-
36
-
37
-
38
-
39
-
40
-
41
-
42
-
43
-
44
-
45
-
46
-
47
-
48
-
49
-
50
-
51
-
52
-
53
-
54
-
55
-
56
-
57
-
58
-
59
-
60
-
61
-
62
-
63
-
64
-
65
-
66
-
67
-
68
-
69
-
70
-
71
-
72
-
73
-
74
-
75
-
76
-
77
-
78
-
79
-
80
-
81
-
82
-
83
-
84
 |
 |

Management’s Discussion and Analysis of Financial Condition and Results of Operations (continued)
Dollars in millions except per share amounts
14
|
AT&T INC.
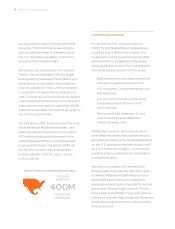
retaining postpaid subscribers, we have recently increased
our focus on prepaid subscribers with our acquisition of Leap,
which operates under the Cricket® brand.
At December 31, 2014, we served 120.6 million subscribers
(including Cricket subscribers from our March 13, 2014
acquisition of Leap, which were approximately 4.5 million
at closing), an increase of 9.2% from the prior year.
Our subscriber base consists primarily of postpaid accounts.
Our prepaid services, which include results from services
sold under the Cricket brand, are monthly prepaid services.
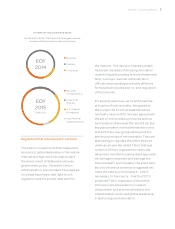
Subscriber Relationships
As the wireless industry continues to mature, we believe that
future wireless growth will increasingly depend on our ability
to offer innovative services, plans and devices and a wireless
network that has sufficient spectrum and capacity to support
these innovations on as broad a geographic basis as possible.
To attract and retain subscribers in a maturing market, we
have launched a wide variety of plans, including Mobile Share
and Mobile Share Value (Mobile Share) and AT&T Next.
While we have historically focused on attracting and
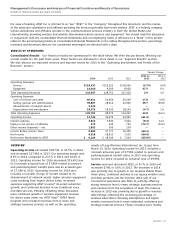
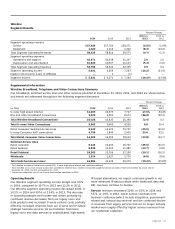
Wireless
Segment Results
Percent Change
2014 vs. 2013 vs.
2014 2013 2012 2013 2012
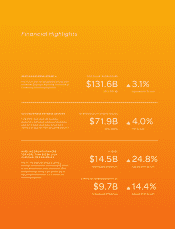
Segment operating revenues
Service $61,032 $61,552 $59,186 (0.8)% 4.0%
Equipment 12,960 8,347 7,577 55.3 10.2
Total Segment Operating Revenues 73,992 69,899 66,763 5.9 4.7
Segment operating expenses
Operations and support 48,924 44,508 43,296 9.9 2.8
Depreciation and amortization 7,941 7,468 6,873 6.3 8.7
Total Segment Operating Expenses 56,865 51,976 50,169 9.4 3.6
Segment Operating Income 17,127 17,923 16,594 (4.4) 8.0
Equity in Net Income (Loss) of Affiliates (112) (75) (62) (49.3) (21.0)
Segment Income $17,015 $17,848 $16,532 (4.7)% 8.0%
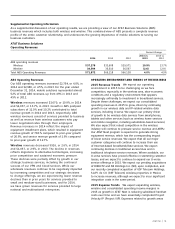
The following table highlights other key measures of performance for the Wireless segment:
Percent Change
2014 vs. 2013 vs.
(in 000s) 2014 2013 2012 2013 2012
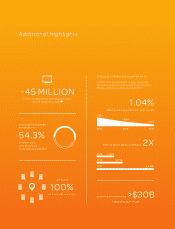
Wireless Subscribers1 120,554 110,376 106,957 9.2% 3.2%
Postpaid smartphones 56,797 51,874 47,076 9.5 10.2
Postpaid feature phones and data-centric devices 19,134 20,764 23,421 (7.9) (11.3)
Postpaid 75,931 72,638 70,497 4.5 3.0
Prepaid 10,986 7,384 7,328 48.8 0.8
Reseller 13,855 14,028 14,875 (1.2) (5.7)
Connected devices2 19,782 16,326 14,257 21.2 14.5
Total Wireless Subscribers 120,554 110,376 106,957 9.2 3.2
Net Additions3
Postpaid 3,290 1,776 1,438 85.2 23.5
Prepaid (775) (13) 128 — —
Reseller (346) (1,074) 1,027 67.8 —
Connected devices2 3,439 2,032 1,171 69.2 73.5
Net Subscriber Additions 5,608 2,721 3,764 106.1% (27.7)%
Mobile Share connections 52,370 21,143 6,626 — —
Smartphones sold under our installment
program during period 15,268 1,540 — — —
Total Churn4 1.45% 1.37% 1.35% 8 BP 2 BP
Postpaid Churn4 1.04% 1.06% 1.09% (2) BP (3) BP
1 Represents 100% of AT&T Mobility wireless subscribers.
2 Includes data-centric devices (e.g., monitoring devices and automobile systems). Excludes tablets, which are primarily included in postpaid.
3 Excludes merger and acquisition-related additions during the period.
4 Calculated by dividing the aggregate number of wireless subscribers who canceled service during a period divided by the total number of wireless subscribers at the
beginning of that period. The churn rate for the period is equal to the average of the churn rate for each month of that period.