AT&T Wireless 2014 Annual Report Download - page 15
Download and view the complete annual report
Please find page 15 of the 2014 AT&T Wireless annual report below. You can navigate through the pages in the report by either clicking on the pages listed below, or by using the keyword search tool below to find specific information within the annual report.-
 1
1 -
2
-
3
-
4
-
 5
5 -
 6
6 -
 7
7 -
 8
8 -
 9
9 -
 10
10 -
 11
11 -
 12
12 -
 13
13 -
 14
14 -
 15
15 -
 16
16 -
 17
17 -
 18
18 -
 19
19 -
 20
20 -
 21
21 -
 22
22 -
 23
23 -
 24
24 -
 25
25 -
26
-
27
-
28
-
29
-
30
-
31
-
32
-
33
-
34
-
35
-
36
-
37
-
38
-
39
-
40
-
41
-
42
-
43
-
44
-
45
-
46
-
47
-
48
-
49
-
50
-
51
-
52
-
53
-
54
-
55
-
56
-
57
-
58
-
59
-
60
-
61
-
62
-
63
-
64
-
65
-
66
-
67
-
68
-
69
-
70
-
71
-
72
-
73
-
74
-
75
-
76
-
77
-
78
-
79
-
80
-
81
-
82
-
83
-
84
 |
 |

AT&T INC.
|
13
and other postemployment benefits, interest expense and
other income (expense) – net, are managed only on a
total company basis and are, accordingly, reflected only
in consolidated results. Therefore, these items are not
included in each segment’s percentage of our total
segment income. Each segment’s percentage of total
segment operating revenue and income calculations is
derived from our segment results, and income percentage
may total more than 100 percent due to losses in one
or more segments. We have two reportable segments:
(1) Wireless and (2) Wireline. Our operating results prior
to May 9, 2012, also included our sold Advertising Solutions
segment (see Note5).
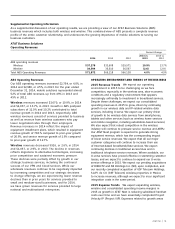
The Wireless segment accounted for approximately 56%
of our 2014 total segment operating revenues as compared
to 54% in 2013 and 75% of our 2014 total segment income
as compared to 74% in 2013. This segment uses our
nationwide network to provide consumer and business
customers with wireless data and voice communications
services. This segment included our portion of the results
from our equity investment in Softcard.
The Wireline segment accounted for approximately 44%
of our 2014 total segment operating revenues as compared
to 46% in 2013 and 25% of our 2014 total segment income
as compared to 26% in 2013. This segment uses
our regional, national and global network to provide
consumer and business customers with data and voice
communications services, U-verse high speed Internet,
video and VoIP services and managed networking to
business customers.
The following sections discuss our operating results by
segment. Operations and support expenses include certain
network planning and engineering expenses; information
technology; our repair technicians and repair services;
property taxes; bad debt expense; advertising costs; sales
and marketing functions, including customer service
centers; real estate costs, including maintenance and
utilities on all buildings; credit and collection functions;
and corporate support costs, such as finance, legal,
human resources and external affairs. Pension and
postretirement service costs, net of amounts capitalized
as part of construction labor, are also included to the
extent that they are associated with employees who
perform these functions.
We discuss capital expenditures for each segment in
“Liquidity and Capital Resources.”
Equity in net income of affiliates decreased $467, or
72.7%, in 2014 and $110, or 14.6%, in 2013. The decrease
in 2014 primarily resulted from the sale of our investment
in América Móvil, S.A. de C.V. (América Móvil) in June 2014
(see Note 5). Lower earnings from YP Holdings LLC
(YP Holdings) and our investment in the mobile payment
joint venture SoftcardTM (Softcard) also contributed to lower
equity in net income of affiliates in 2014. The decrease in
2013 was due to lower earnings from América Móvil and
increased expenses in Softcard, partially offset by increased
earnings from YP Holdings.
2014 2013 2012
América Móvil $ 153 $532 $686
YP Holdings 134 182 130
Softcard (112) (75) (62)
Other — 3 (2)
Equity in Net Income of Affiliates $ 175 $642 $752
Other income (expense) – net We had other income of
$1,652 in 2014, $596 in 2013 and $134 in 2012. Results for
2014 included a combined net gain of $1,541 on the sale
of América Móvil shares, our Connecticut operations and
other investments, interest and dividend income of $68,
and leveraged lease income of $29.
Other income for 2013 included a net gain on the sale of
América Móvil shares and other investments of $498,
interest and dividend income of $68, and leveraged lease
income of $26. Results for 2012 included net gains on the
sale of investments of $74, interest and dividend income
of $61, and leveraged lease income of $55. This income
was partially offset by $57 of investment impairments.
Income tax expense decreased $5,782 in 2014 and
increased $6,324 in 2013. The decrease in 2014 and
increase in 2013 were primarily due to a change in income
before income taxes. Our effective tax rate was 34.6% in
2014, 33.2% in 2013 and 27.8% in 2012 (see Note 11).
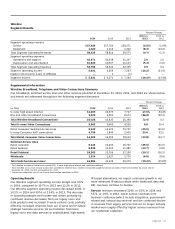
Segment Results
Our segments are strategic business units that offer
different products and services over various technology
platforms and are managed accordingly. Our operating
segment results presented in Note 4 and discussed below
for each segment follow our internal management
reporting. We analyze our operating segments based on
segment income before income taxes. We make our capital
allocation decisions based on the strategic needs of the
business, needs of the network (wireless or wireline)
providing services and to provide emerging services to
our customers. Actuarial gains and losses from pension