AT&T Wireless 2014 Annual Report Download - page 53
Download and view the complete annual report
Please find page 53 of the 2014 AT&T Wireless annual report below. You can navigate through the pages in the report by either clicking on the pages listed below, or by using the keyword search tool below to find specific information within the annual report.-
 1
1 -
2
-
3
-
4
-
5
-
6
-
7
-
8
-
9
-
10
-
11
-
12
-
13
-
14
-
15
-
16
-
17
-
18
-
19
-
20
-
21
-
22
-
23
-
24
-
25
-
26
-
27
-
28
-
29
-
30
-
31
-
32
-
33
-
34
-
35
-
36
-
37
-
38
-
39
-
40
-
41
-
42
-
 43
43 -
 44
44 -
 45
45 -
 46
46 -
 47
47 -
 48
48 -
 49
49 -
 50
50 -
 51
51 -
 52
52 -
 53
53 -
 54
54 -
 55
55 -
 56
56 -
 57
57 -
 58
58 -
 59
59 -
 60
60 -
 61
61 -
 62
62 -
 63
63 -
64
-
65
-
66
-
67
-
68
-
69
-
70
-
71
-
72
-
73
-
74
-
75
-
76
-
77
-
78
-
79
-
80
-
81
-
82
-
83
-
84
 |
 |

AT&T INC.
|
51
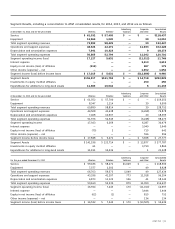
Segment Results, including a reconciliation to AT&T consolidated results, for 2014, 2013, and 2012 are as follows:
Advertising Corporate Consolidated
At December 31, 2014 and for the year ended Wireless Wireline Solutions and Other Results
Service $ 61,032 $ 57,405 $ — $ — $118,437
Equipment 12,960 1,020 — 30 14,010
Total segment operating revenues 73,992 58,425 — 30 132,447
Operations and support expenses 48,924 42,471 — 11,033 102,428
Depreciation and amortization expenses 7,941 10,323 — 9 18,273
Total segment operating expenses 56,865 52,794 — 11,042 120,701
Segment operating income (loss) 17,127 5,631 — (11,012) 11,746
Interest expense — — — 3,613 3,613
Equity in net income (loss) of affiliates (112) — — 287 175
Other income (expense) – net — — — 1,652 1,652
Segment income (loss) before income taxes $ 17,015 $ 5,631 $ — $(12,686) $ 9,960
Segment Assets $156,317 $121,794 $ — $ 14,718 $292,829
Investments in equity method affiliates — — — 250 250
Expenditures for additions to long-lived assets 11,383 10,044 — 6 21,433
Advertising Corporate Consolidated
At December 31, 2013 and for the year ended Wireless Wireline Solutions and Other Results
Service $ 61,552 $ 57,700 $ — $ — $ 119,252
Equipment 8,347 1,114 — 39 9,500
Total segment operating revenues 69,899 58,814 — 39 128,752
Operations and support expenses 44,508 41,638 — (6,268) 79,878
Depreciation and amortization expenses 7,468 10,907 — 20 18,395
Total segment operating expenses 51,976 52,545 — (6,248) 98,273
Segment operating income 17,923 6,269 — 6,287 30,479
Interest expense — — — 3,940 3,940
Equity in net income (loss) of affiliates (75) 2 — 715 642
Other income (expense) – net — — — 596 596
Segment income before income taxes $ 17,848 $ 6,271 $ — $ 3,658 $ 27,777
Segment Assets $ 141,196 $ 123,714 $ — $ 12,877 $ 277,787
Investments in equity method affiliates 61 — — 3,799 3,860
Expenditures for additions to long-lived assets 11,191 10,036 — 1 21,228
Advertising Corporate Consolidated
For the year ended December 31, 2012 Wireless Wireline Solutions and Other Results
Service $ 59,186 $ 58,271 $1,049 $ — $ 118,506
Equipment 7,577 1,302 — 49 8,928
Total segment operating revenues 66,763 59,573 1,049 49 127,434
Operations and support expenses 43,296 41,207 773 11,018 96,294
Depreciation and amortization expenses 6,873 11,123 106 41 18,143
Total segment operating expenses 50,169 52,330 879 11,059 114,437
Segment operating income (loss) 16,594 7,243 170 (11,010) 12,997
Interest expense — — — 3,444 3,444
Equity in net income (loss) of affiliates (62) (1) — 815 752
Other income (expense) – net — — — 134 134
Segment income (loss) before income taxes $ 16,532 $ 7,242 $ 170 $ (13,505) $ 10,439