AT&T Wireless 2014 Annual Report Download - page 29
Download and view the complete annual report
Please find page 29 of the 2014 AT&T Wireless annual report below. You can navigate through the pages in the report by either clicking on the pages listed below, or by using the keyword search tool below to find specific information within the annual report.-
 1
1 -
2
-
3
-
4
-
5
-
6
-
7
-
8
-
9
-
10
-
11
-
12
-
13
-
14
-
15
-
16
-
17
-
18
-
 19
19 -
 20
20 -
 21
21 -
 22
22 -
 23
23 -
 24
24 -
 25
25 -
 26
26 -
 27
27 -
 28
28 -
 29
29 -
 30
30 -
 31
31 -
 32
32 -
 33
33 -
 34
34 -
 35
35 -
 36
36 -
 37
37 -
 38
38 -
 39
39 -
40
-
41
-
42
-
43
-
44
-
45
-
46
-
47
-
48
-
49
-
50
-
51
-
52
-
53
-
54
-
55
-
56
-
57
-
58
-
59
-
60
-
61
-
62
-
63
-
64
-
65
-
66
-
67
-
68
-
69
-
70
-
71
-
72
-
73
-
74
-
75
-
76
-
77
-
78
-
79
-
80
-
81
-
82
-
83
-
84
 |
 |

AT&T INC.
|
27
value. In 2014 and 2012, we identified an immaterial
other-than-temporary decline in the value of equity
method investments and various cost investments.
Income Taxes Our estimates of income taxes and
the significant items giving rise to the deferred assets
and liabilities are shown in Note 11 and reflect our
assessment of actual future taxes to be paid on
items reflected in the financial statements, giving
consideration to both timing and probability of these
estimates. Actual income taxes could vary from these
estimates due to future changes in income tax law
or the final review of our tax returns by federal, state
or foreign tax authorities.
We use our judgment to determine whether it is
more likely than not that we will sustain positions
that we have taken on tax returns and, if so, the
amount of benefit to initially recognize within our
financial statements. We regularly review our uncertain
tax positions and adjust our unrecognized tax benefits
(UTBs) in light of changes in facts and circumstances,
such as changes in tax law, interactions with taxing
authorities and developments in case law. These
adjustments to our UTBs may affect our income tax
expense. Settlement of uncertain tax positions may
require use of our cash.
New Accounting Standards
See Note 1 for a discussion of recently issued or adopted
accounting standards.
OTHER BUSINESS MATTERS
DIRECTV Acquisition In May 2014, we announced a
merger agreement to acquire DIRECTV in a stock-and-cash
transaction for ninety-five dollars per share of DIRECTV’s
common stock, or approximately $48,500 at the date of
announcement. As of December 31, 2014, DIRECTV had
approximately $16,177 in net debt. Each DIRECTV
shareholder will receive cash of $28.50 per share and
$66.50 per share in our stock subject to a collar such that
DIRECTV shareholders will receive 1.905 AT&T shares if our
average stock price is below $34.90 per share at closing
and 1.724 AT&T shares if our average stock price is above
$38.58 at closing. If our average stock price (calculated
in accordance with the merger agreement with DIRECTV)
is between $34.90 and $38.58 at closing, then DIRECTV
shareholders will receive a number of shares between 1.724
and 1.905, equal to $66.50 in value. DIRECTV is a premier
pay TV provider in the United States and Latin America,
with a high-quality customer base, the best selection of
programming, the best technology for delivering and
viewing high-quality video on any device and the best
customer satisfaction among major U.S. cable and satellite
TV providers.
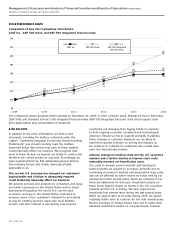
churn rates will increase in 2015 from our rate of 1.45%
in 2014, in line with expected trends in the industry
but at a rate comparable with industry-leading churn.
EBITDA service margins were assumed to continue to
trend to at least 40% annually.
This model then incorporates cash flow assumptions
regarding investment in the network, development of
distribution channels and the subscriber base, and other
inputs for making the business operational. We based
the assumptions, which underlie the development of
the network, subscriber base and other critical inputs
of the discounted cash flow model, on a combination
of average marketplace participant data and our
historical results, trends and business plans. We also
used operating metrics such as capital investment per
subscriber, acquisition costs per subscriber, minutes of
use per subscriber, etc., to develop the projected cash
flows. Since we included the cash flows associated
with these other inputs in the annual cash flow
projections, the present value of the unlevered free
cash flows of the segment, after investment in the
network, subscribers, etc., is attributable to the wireless
FCC licenses. The terminal value of the segment, which
incorporates an assumed sustainable growth rate, is
also discounted and is likewise attributed to the
licenses. We used a discount rate of 8.5%, based on
the optimal long-term capital structure of a market
participant and its associated cost of debt and equity,
to calculate the present value of the projected cash
flows. This discount rate is also consistent with rates
we use to calculate the present value of the projected
cash flows of licenses acquired from third parties.
If either the projected rate of long-term growth of cash
flows or revenues declined by 1%, or if the discount
rate increased by 1%, the fair values of the wireless
FCC licenses, while less than currently projected, would
still be higher than the book value of the licenses.
The fair value of the licenses exceeded the book value
by more than 25%.
We review customer relationships and other long-lived
assets for impairment whenever events or circumstances
indicate that the carrying amount may not be
recoverable over the remaining life of the asset or asset
group. To determine that the asset is recoverable, we
verify that the expected undiscounted future cash flows
directly related to that asset exceed its book value.
We evaluate our investments to determine whether
market declines are temporary and accordingly reflected
in accumulated other comprehensive income, or other-
than-temporary and recorded as an expense in “Other
income (expense) – net” in the consolidated statements
of income. This evaluation is based on the length of
time and the severity of decline in the investment’s