AT&T Wireless 2014 Annual Report Download - page 70
Download and view the complete annual report
Please find page 70 of the 2014 AT&T Wireless annual report below. You can navigate through the pages in the report by either clicking on the pages listed below, or by using the keyword search tool below to find specific information within the annual report.-
 1
1 -
2
-
3
-
4
-
5
-
6
-
7
-
8
-
9
-
10
-
11
-
12
-
13
-
14
-
15
-
16
-
17
-
18
-
19
-
20
-
21
-
22
-
23
-
24
-
25
-
26
-
27
-
28
-
29
-
30
-
31
-
32
-
33
-
34
-
35
-
36
-
37
-
38
-
39
-
40
-
41
-
42
-
43
-
44
-
45
-
46
-
47
-
48
-
49
-
50
-
51
-
52
-
53
-
54
-
55
-
56
-
57
-
58
-
59
-
 60
60 -
 61
61 -
 62
62 -
 63
63 -
 64
64 -
 65
65 -
 66
66 -
 67
67 -
 68
68 -
 69
69 -
 70
70 -
 71
71 -
 72
72 -
 73
73 -
 74
74 -
 75
75 -
 76
76 -
 77
77 -
 78
78 -
 79
79 -
 80
80 -
81
-
82
-
83
-
84
 |
 |

Notes to Consolidated Financial Statements (continued)
Dollars in millions except per share amounts
68
|
AT&T INC.
Purchases and sales of securities are recorded as of the
trade date. Realized gains and losses on sales of securities
are determined on the basis of average cost. Interest
income is recognized on the accrual basis. Dividend income
is recognized on the ex-dividend date.
Non-interest bearing cash and overdrafts are valued at
cost, which approximates fair value.
Fair Value Measurements
See Note 10 for a discussion of fair value hierarchy that
prioritizes the inputs to valuation techniques used to
measure fair value.
where such quotes are available, fair value will be
determined based solely upon such quotes provided.
Managers will typically use a pricing matrix for determining
fair value in cases where an approved pricing service
or a broker/dealer is unable to provide a fair valuation
for specific fixed-rate securities such as many private
placements. New fixed-rate securities will be initially valued
at cost at the time of purchase. Thereafter, each bond will
be assigned a spread from a pricing matrix that will be
added to current Treasury rates. The pricing matrix derives
spreads for each bond based on external market data,
including the current credit rating for the bonds, credit
spreads to Treasuries for each credit rating, sector add-ons
or credits, issue specific add-ons or credits as well as call
or other options.
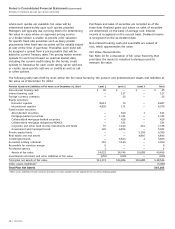
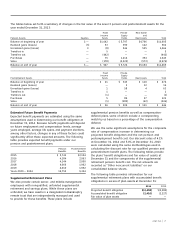
The following table sets forth by level, within the fair value hierarchy, the pension and postretirement assets and liabilities at
fair value as of December 31, 2014:
Pension Assets and Liabilities at Fair Value as of December 31, 2014 Level 1 Level 2 Level 3 Total
Non-interest bearing cash $ 45 $ — $ — $ 45
Interest bearing cash — 127 — 127
Foreign currency contracts — 25 — 25
Equity securities:
Domestic equities 8,613 74 — 8,687
International equities 4,805 171 — 4,976
Fixed income securities:
Asset-backed securities — 610 1 611
Mortgage-backed securities — 1,741 — 1,741
Collateralized mortgage-backed securities — 418 — 418
Collateralized mortgage obligations/REMICS — 531 — 531
Corporate and other fixed income instruments and funds 97 7,210 441 7,748
Government and municipal bonds 145 4,876 — 5,021
Private equity funds — — 5,399 5,399
Real estate and real assets — — 4,845 4,845
Commingled funds — 5,823 2 5,825
Securities lending collateral 310 3,140 — 3,450
Receivable for variation margin 6 — — 6
Purchased options 1 — — 1
Assets at fair value 14,022 24,746 10,688 49,456
Investments sold short and other liabilities at fair value (650) (260) — (910)
Total plan net assets at fair value $13,372 $24,486 $10,688 $ 48,546
Other assets (liabilities)1 (3,383)
Total Plan Net Assets $45,163
1 Other assets (liabilities) include amounts receivable, accounts payable and net adjustment for securities lending payable.