AT&T Wireless 2014 Annual Report Download - page 72
Download and view the complete annual report
Please find page 72 of the 2014 AT&T Wireless annual report below. You can navigate through the pages in the report by either clicking on the pages listed below, or by using the keyword search tool below to find specific information within the annual report.
Notes to Consolidated Financial Statements (continued)
Dollars in millions except per share amounts
70
|
AT&T INC.
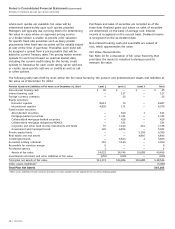
The following tables set forth by level, within the fair value hierarchy, the pension and postretirement assets and liabilities at
fair value as of December 31, 2013:
Pension Assets and Liabilities at Fair Value as of December 31, 2013 Level 1 Level 2 Level 3 Total
Non-interest bearing cash $ 65 $ — $ — $ 65
Interest bearing cash — 324 — 324
Foreign currency contracts — 3 — 3
Equity securities:
Domestic equities 9,841 3 — 9,844
International equities 6,431 7 — 6,438
Fixed income securities:
Asset-backed securities — 553 3 556
Mortgage-backed securities — 2,470 — 2,470
Collateralized mortgage-backed securities — 364 — 364
Collateralized mortgage obligations/REMICS — 514 — 514
Corporate and other fixed income instruments and funds 154 5,147 540 5,841
Government and municipal bonds 15 4,566 — 4,581
Private equity funds — — 5,724 5,724
Real estate and real assets — — 5,194 5,194
Commingled funds — 6,358 4 6,362
Securities lending collateral 390 3,074 — 3,464
Receivable for variation margin 12 — — 12
Assets at fair value 16,908 23,383 11,465 51,756
Investments sold short and other liabilities at fair value (619) (5) — (624)
Total plan net assets at fair value $16,289 $23,378 $11,465 $51,132
Other assets (liabilities)1 (3,894)
Total Plan Net Assets $47,238
1 Other assets (liabilities) include amounts receivable, accounts payable and net adjustment for securities lending payable.
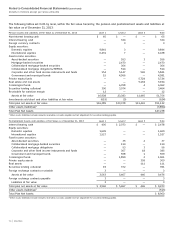
Postretirement Assets and Liabilities at Fair Value as of December 31, 2013 Level 1 Level 2 Level 3 Total
Interest bearing cash $ 405 $ 2,073 $ — $ 2,478
Equity securities:
Domestic equities 1,609 — — 1,609
International equities 1,527 — — 1,527
Fixed income securities:
Asset-backed securities — 35 2 37
Collateralized mortgage-backed securities — 110 — 110
Collateralized mortgage obligations — 53 3 56
Corporate and other fixed income instruments and funds — 367 18 385
Government and municipal bonds — 558 1 559
Commingled funds — 1,899 2 1,901
Private equity assets — — 309 309
Real assets — — 111 111
Securities lending collateral 19 372 — 391
Foreign exchange contracts receivable 3 — — 3
Assets at fair value 3,563 5,467 446 9,476
Foreign exchange contracts payable 3 — — 3
Liabilities at fair value 3 — — 3
Total plan net assets at fair value $ 3,560 $ 5,467 $ 446 $ 9,473
Other assets (liabilities)1 (513)
Total Plan Net Assets $ 8,960
1 Other assets (liabilities) include amounts receivable, accounts payable and net adjustment for securities lending payable.


